Hey, everyone!
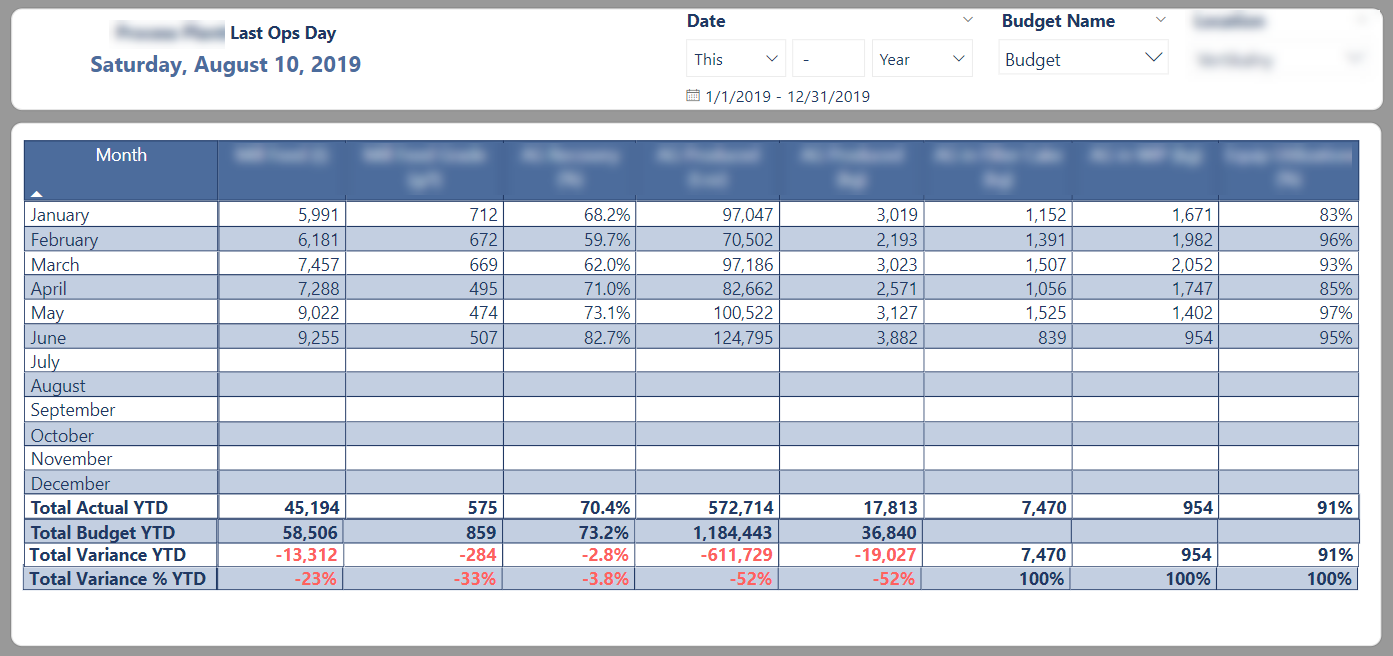
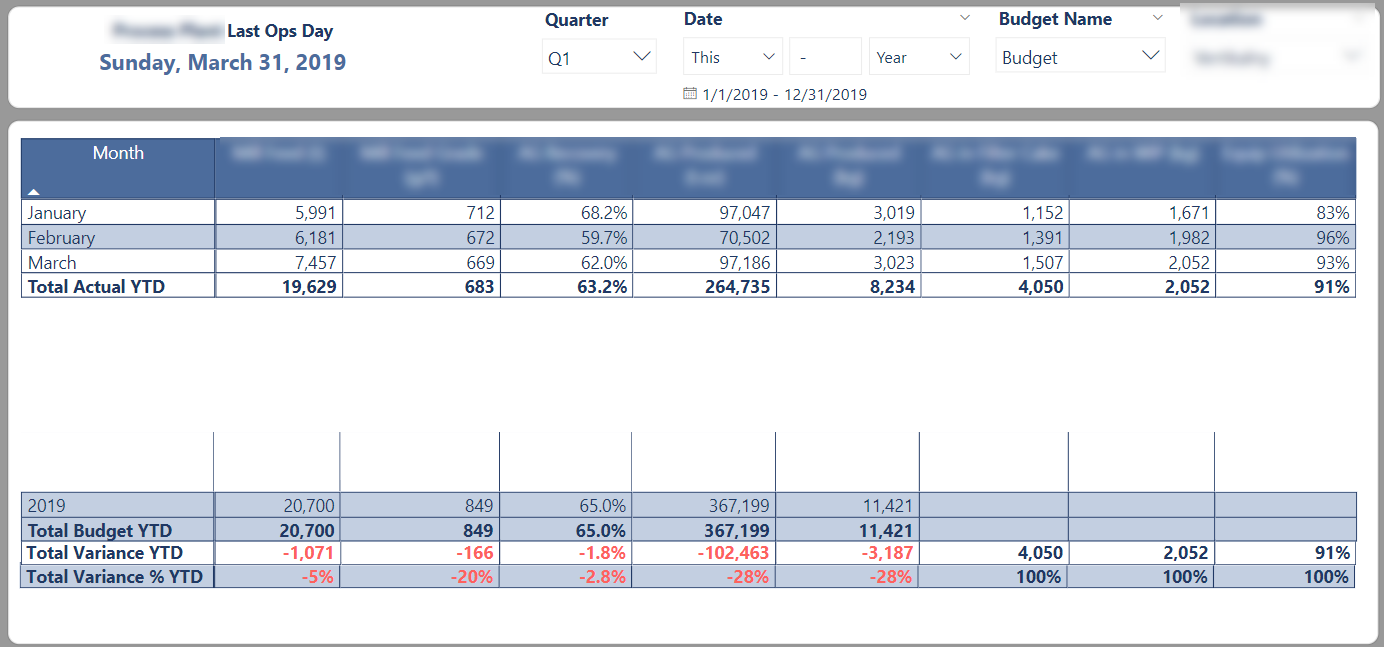
I am trying to figure out how to display a martix showing all months of a year and make it respect other slicers (for instance, if Q1 is selected), BUT the month rows in the matrix must still persist). I have a relative date slicer that accomplishes that, but as soon as I add another slicer, the table shrinks to only show with the data for the rows or selected months once another slicer is used).
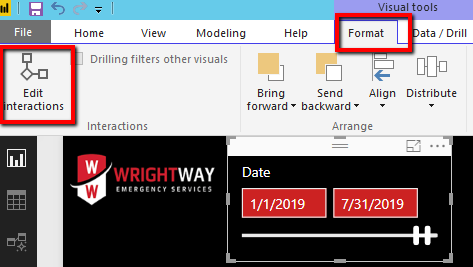
There really isn’t a definitive answer to your question without looking at some sample data. Please post a PBIX file so that we can better assist. One possible answer is for your second slicer to have it not interact with your table(s) by clicking on Format, Edit Interactions.
Thanks
![]()
You can definitely use the suggestion above.
Another thought though is you can use ideas covered in this below tutorial.
It’s not exactly the same scenario but I’m hoping it will give you an idea around setting up another date table which isn’t connected to your model, then integrating it in via DAX formula.
Thanks
Sam
Thank you for your suggestion, however if I turn off the slicer’s interaction with the main table, it simply ignores the slicer’s selections and does not solve the problem as the data itself is only affected by other slicers. It’s like not having that particular slicer at all. I was thinking of creating a measure that would have a value in every month and also ignoring any slicer selections (and hiding the measure in a table), but that seems like not a very nice or clean way of handling the problem, either.
Thank you! I have reviewed your video and your post in depth. The issue is that it’s not one particular measure that is needed to be filtered out, it’s all of them in that same visual (matrix, in this case). So, there needs to be something that drives the table to be “open” for all months. I tried creating an index measure collapsing/hiding it, but it gets filtered out all the same…
The way I have it now (as a workaround) is I adjusted all the measures to be offset back by a number of months that is needed to be shown in the matrix, but as you can imagine, it is not a viable long-term solution. Coming at it from the measures side, though - perhaps a month offset filter that measures would respect?
Also, I found this Microsoft article called Showing items with no data, but it seems like a default setting that doesn’t really address the “unselected” concept of my need.
Oh ok, so I guess you just need to select the ‘show items with no data’?
Is this what you’ve done in the end. This is really simple to do.
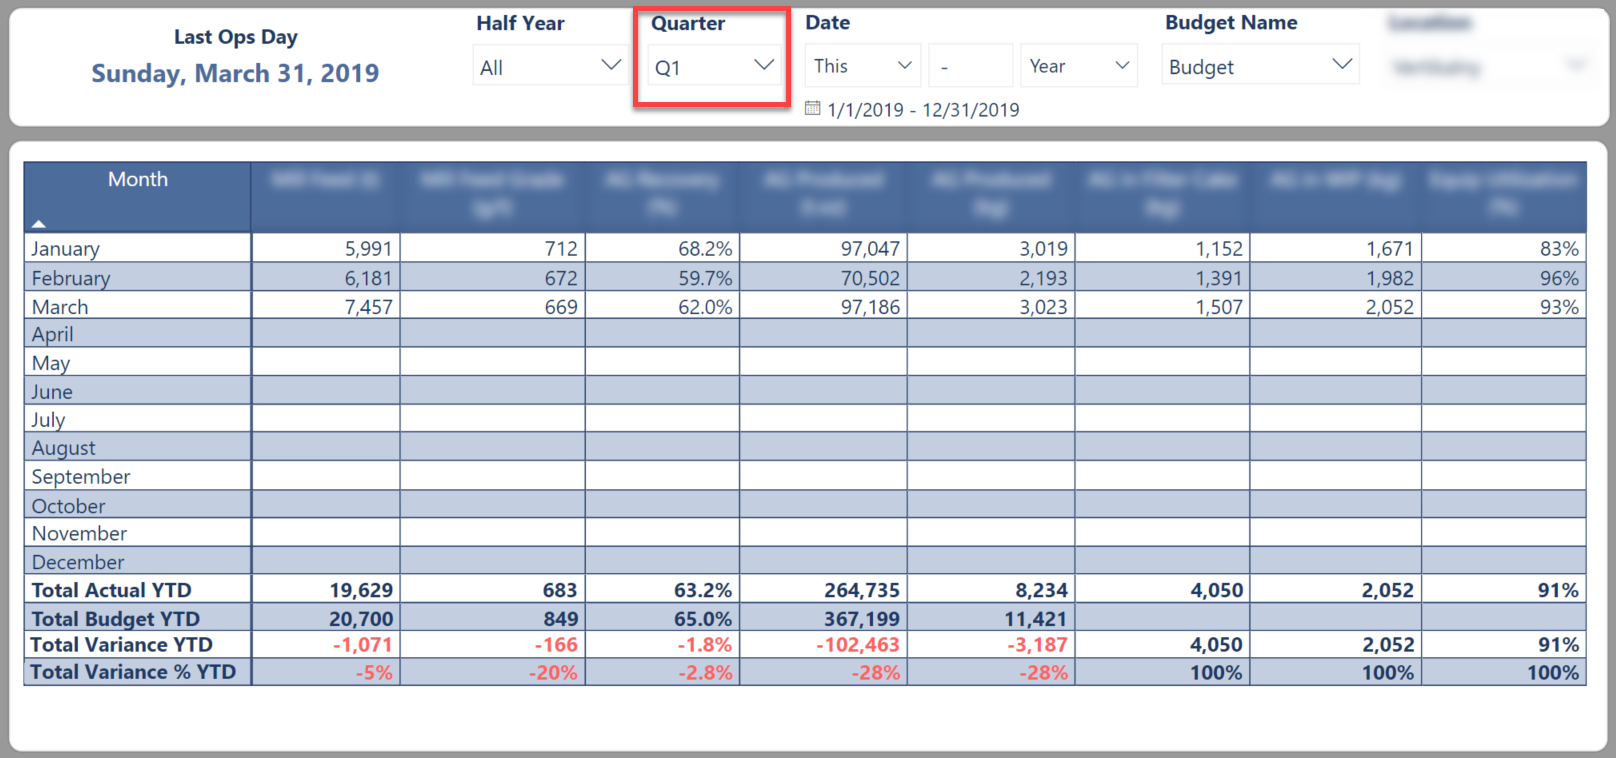
Not really. It’s selected by default and it works for when you use Relative option on Date slicer with “This year” selected. But the moment you filter the data for let’s say Q1 with another slicer (or select anything other than a full year in the same slicer), it still automatically reduces the table to first three months. We want to keep the table size intact.
Can you add a demo file of the scenario. This would assist further.
Thanks
Creating a secondary date table actually worked! Month dimension in the matrix visual needs to be coming from that secondary date table. Since there are no filters on that secondary date table, it brings all the months into the matrix visual. In the data model it needs to be connected to the fact tables, just like the original date table.
Ok great