Hello,
I’m trying to display a list of measure names as dimension names in rows. So I created new table in DAX using the UNION and ROW functions. Here is a snippet :
Indicateurs =
UNION(
ROW( “CAUSES” , “OTHER”, “VALUES” , [Other HM] ),
ROW( “CAUSES” , “CHARGE_AVG”, “VALUES” , [Charge avg.] )
)
The problem is that the measures are not filtered when added to the report (VALUES column).
I would like to have a table like this :
CAUSES VALUES
OTHER 999
CHARGE_AVG 888
Note that the values under CAUSES do not exist in my Fact table. This is a new type of dimension that the client would like to analyse their data by. I thought by creating a table in DAX, I could set the row values (CAUSES) and add the necessary measure but unfortunetely that does not work.
The measures filter correctly when added directly to the report, example with a Card graphic.
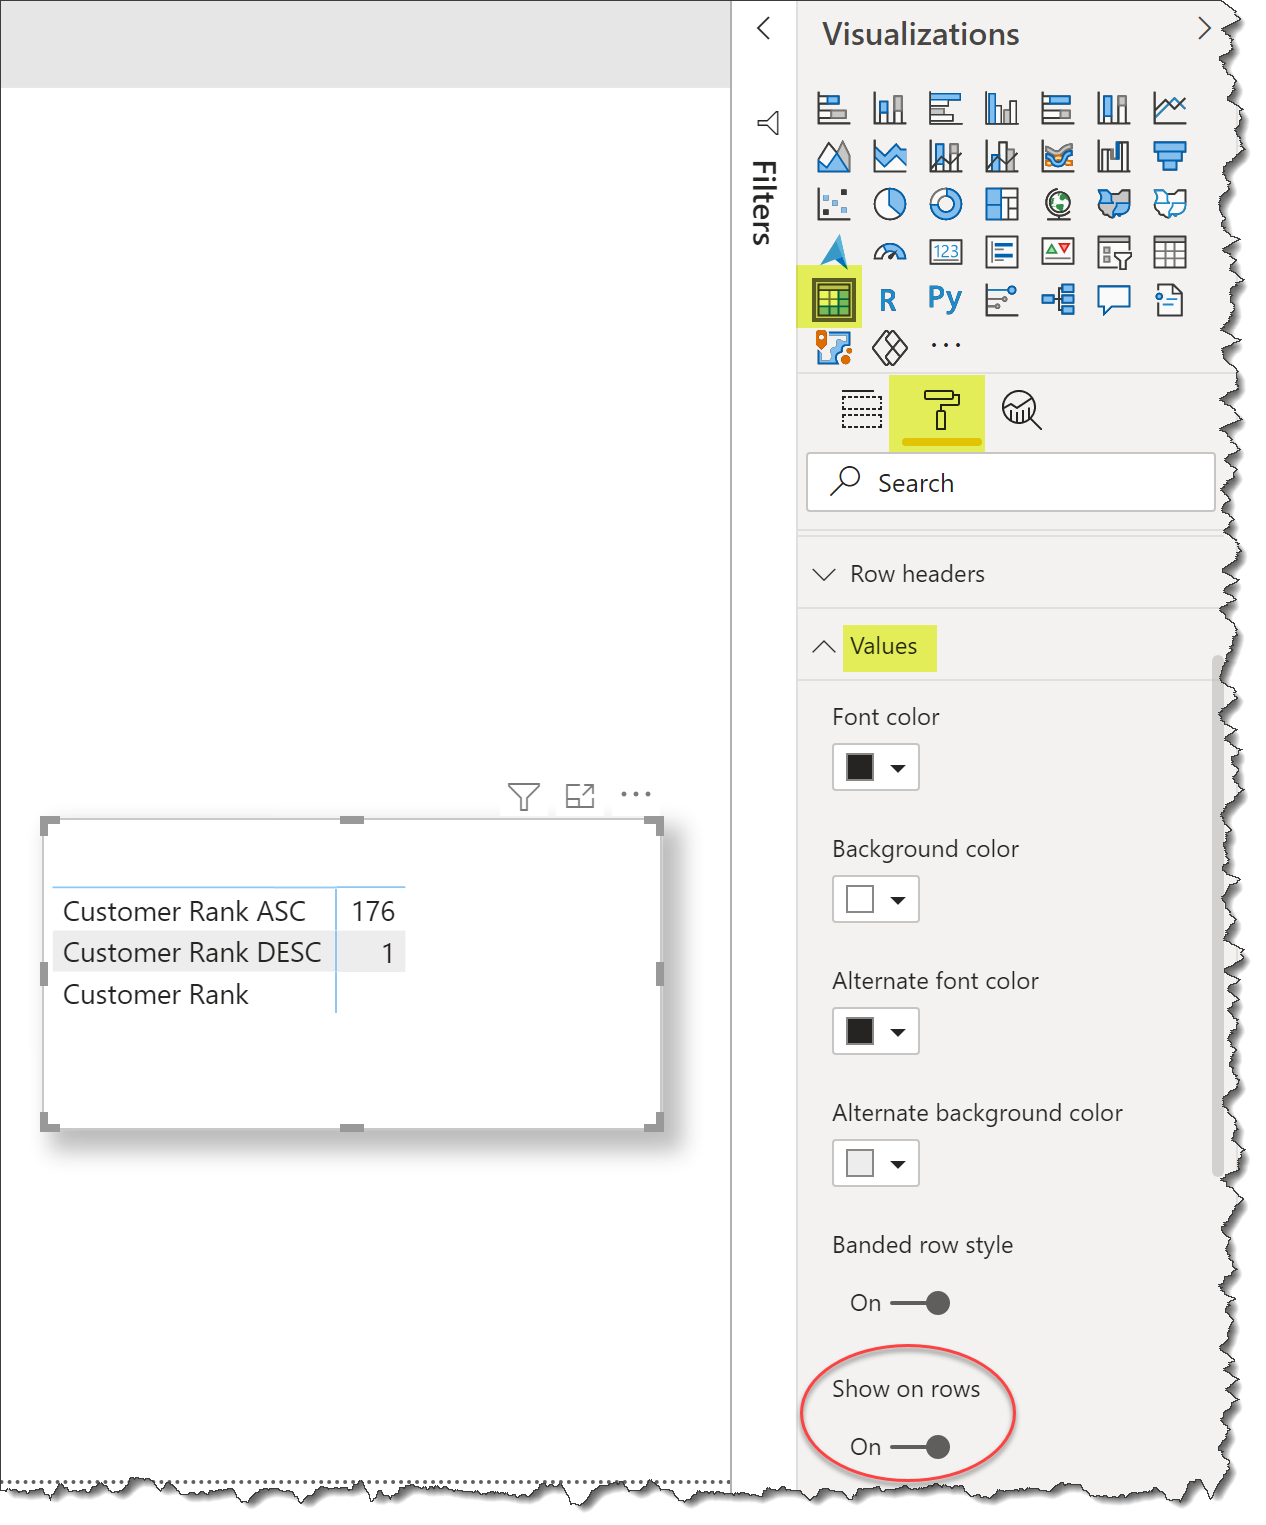
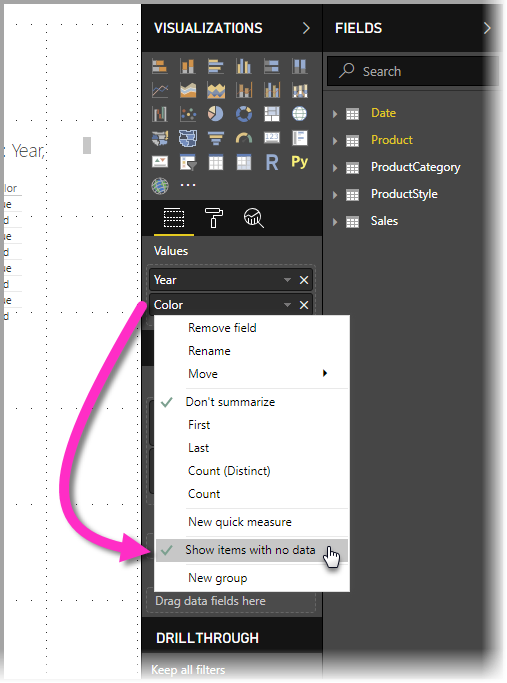
Hi @Fiona. If you need to show a value even if there are no rows, try adding zero to your measures (e.g., [Total Sales] = SUM( Sales[Line Total] ) + 0). To display measures in a “table”, try using a matrix instead of a table and showing the values on rows.
Greg
I think I may be close to a solution (it’s midnight already here so I’ll have to confirmer tomorrow if all the data is filtered out well lol)
Well I did the following and the measures seem to filter correctly :
Created a Data Table with the static names of my “measure dimensions”
(TU - DATATABLE) TABLE =
DATATABLE(
“Measure ID” , INTEGER ,
“Measure Name” , STRING ,
{
{ 1,“AUTERS_TEMPS_ATT”} ,
{ 2,“CHARGE_MOY”} ,
{ 3,“DISTANCE_MOY”},
{ 4,“TPS_CHGT”} ,
{ 5,“TPS_DECHGT”} ,
{ 6,“TPS_ATT_VIDE”} ,
{ 7,“TPS_ATT_CHARGE”} ,
{ 8,“TPS_VITESSE_MOY”}
}
)
I then created another measure to pull in the correct measures based on the dimension names above :
Dynamic Measure =
VAR nomMesure = Min (’(TU - DATATABLE) TABLE’[Measure Name])