Hello Everyone:
I am new to this forum and trying to build a PBI file for client where the requirement is to select the month from the connected date table slicer with my Fact table and display the Last N months by selecting the month using Single date from the connected Slicer.
I have a Fiscal Year calendar with month starting Sep.
FY16 : Sep 15 till Aug 16
FY17 : Sep 16 till Aug 17
I am currently using the below measure to bring in the last n months
Total Transactions (last n months) =
CALCULATE (
[Total Transactions] ,
DATESINPERIOD ( DimCalendar[Date], MAX ( DimCalendar[Date] ), -[NMonth Value], MONTH )
)
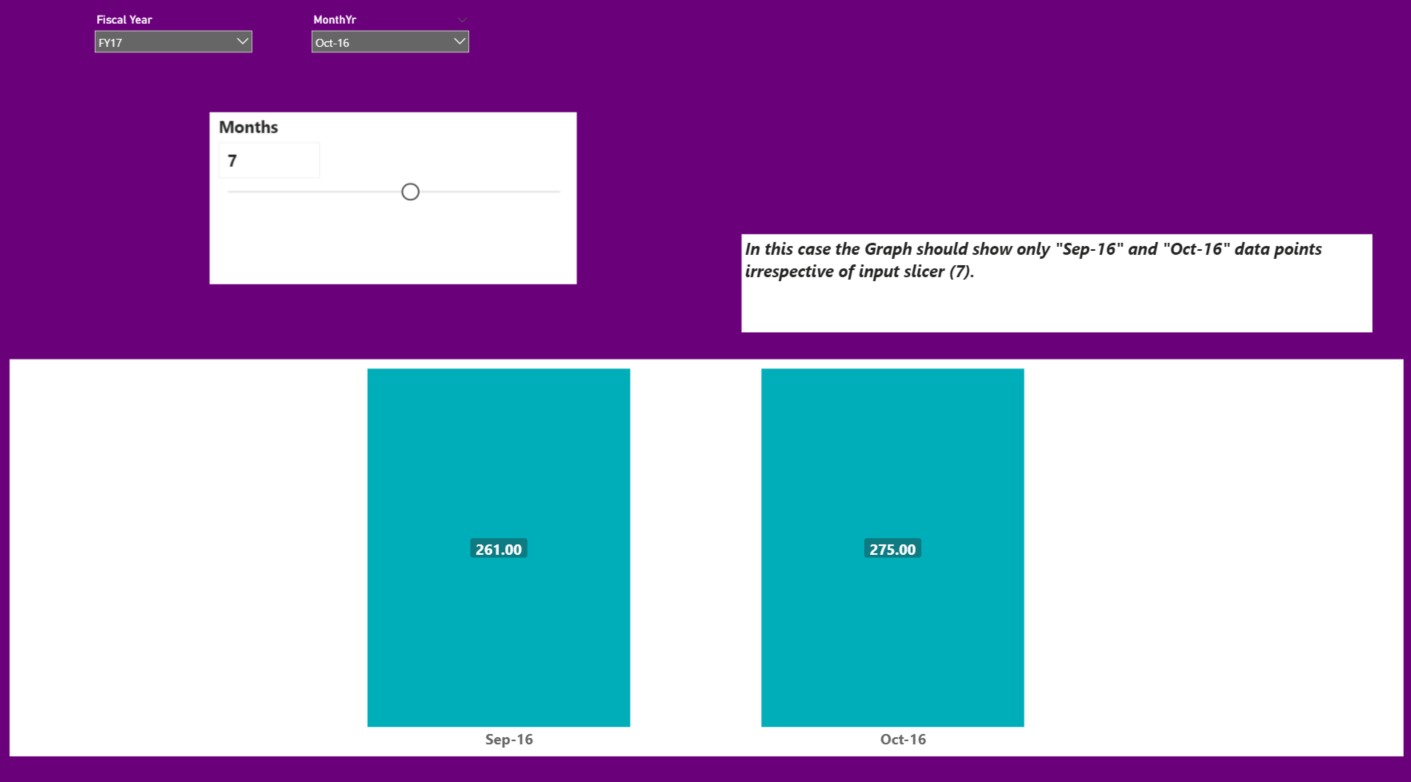
However, the challenge what am facing is to when I select Oct-16 it should show only the “Sep-16” and “Oct-16” bar in the column chart, irrespective of the input month slicer.
The input slicer will help the user to slide between the number of available months and view the column graph.
Requesting your guidance on this Measure or a feasible solution.
Thanks in advance.
Best Regards
Afzal
Test Data.pbix (5.5 MB)