Hi all,
I’ve been trying to figure this out for some time now, and after scanning the internet I cant seem to find anyone with a similar problem. I have tried to incorporate some of the measures I have found online but with no success.
The problem;
I have a list of projects and project-IDs that are classified into various categories (table: Projects). For simplicity-sake I have narrowed it down to three categories; Health, Observational and Other. Each project must at least have one classification, but can be classified into 1, 2 or 3 categories, e.g. Health and Other.
I figured I should make a disconnected table, so I have done that (Categories in pbix-file) which only contains one coloumn consisting of the three different categories.
Then I made three measures, that “should” calculate the number of projects that conains the words; Health, Observational or Other (Measures; No. of Health-projects, No. of Observational-projects and No. of Other-projects in pbix-file). I used the following DAX for that:
No. of Health-projects =
    CALCULATE(
        COUNTROWS(
            DISTINCT(
                SELECTCOLUMNS(
                FILTER(
                Projects,
            CONTAINSSTRING(Projects[Category],"Health")),
            Projects[Project ID] )
            )))
The reason I put in “Projects[Project ID]” in this formula is that the SELECTCOLUMNS requires at least two coloumns. Maybe this is a reason for why this fails?
Next I made a measure to see If my disconnected table were set up correctly using this;
Test to see if showing =
VAR X =
    VALUES ( Categories[Categories] )
VAR y =
    MAX ( Projects[Category] )
VAR filtered =
    FILTER ( x, CONTAINSSTRING ( y, Categories[Categories] ) )
RETURN
    IF ( COUNTROWS ( filtered ) > 0, "Yes", "No" )
And it does (see matrix in PBIX-file)!
To calculate the number of projects that contains each of the three categories, I adopted a DAX-formula by G.Deckler and tried to adopt it to fit my problem;
Visual =
IF(
    SWITCH(
        VALUES(Categories[Categories]),
        	"Health",[No. of Health-projects],
        	"Observational", [No. of Observational-projects],
            "Other", [No. of Other-projects]
	 		),
			"Error")
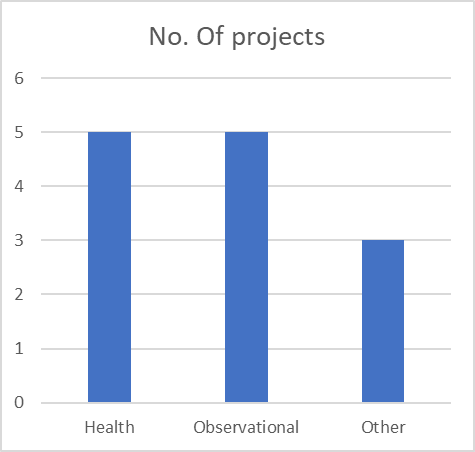
This is where I get stuck. I cant get the measure to work in my visual. I want to be able to show this as graph with the three categories from the disconnected table onthe x-axis and the number for the corresponding categories onthe y-axis. I also want to be able to display this in a matrix (if possible). Graph will be somthing along the lines of this:
I have attached the pbix-file and Excel-file so that you can see the data-set and the measures I have used to try to solve this.
Projects.xlsx (8.9 KB)
Projects.pbix (29.7 KB)
Thanks