Disappearing Total in matrix

Hi,

earlier I got help on the measure I will ask help today, and it’s working perfect.
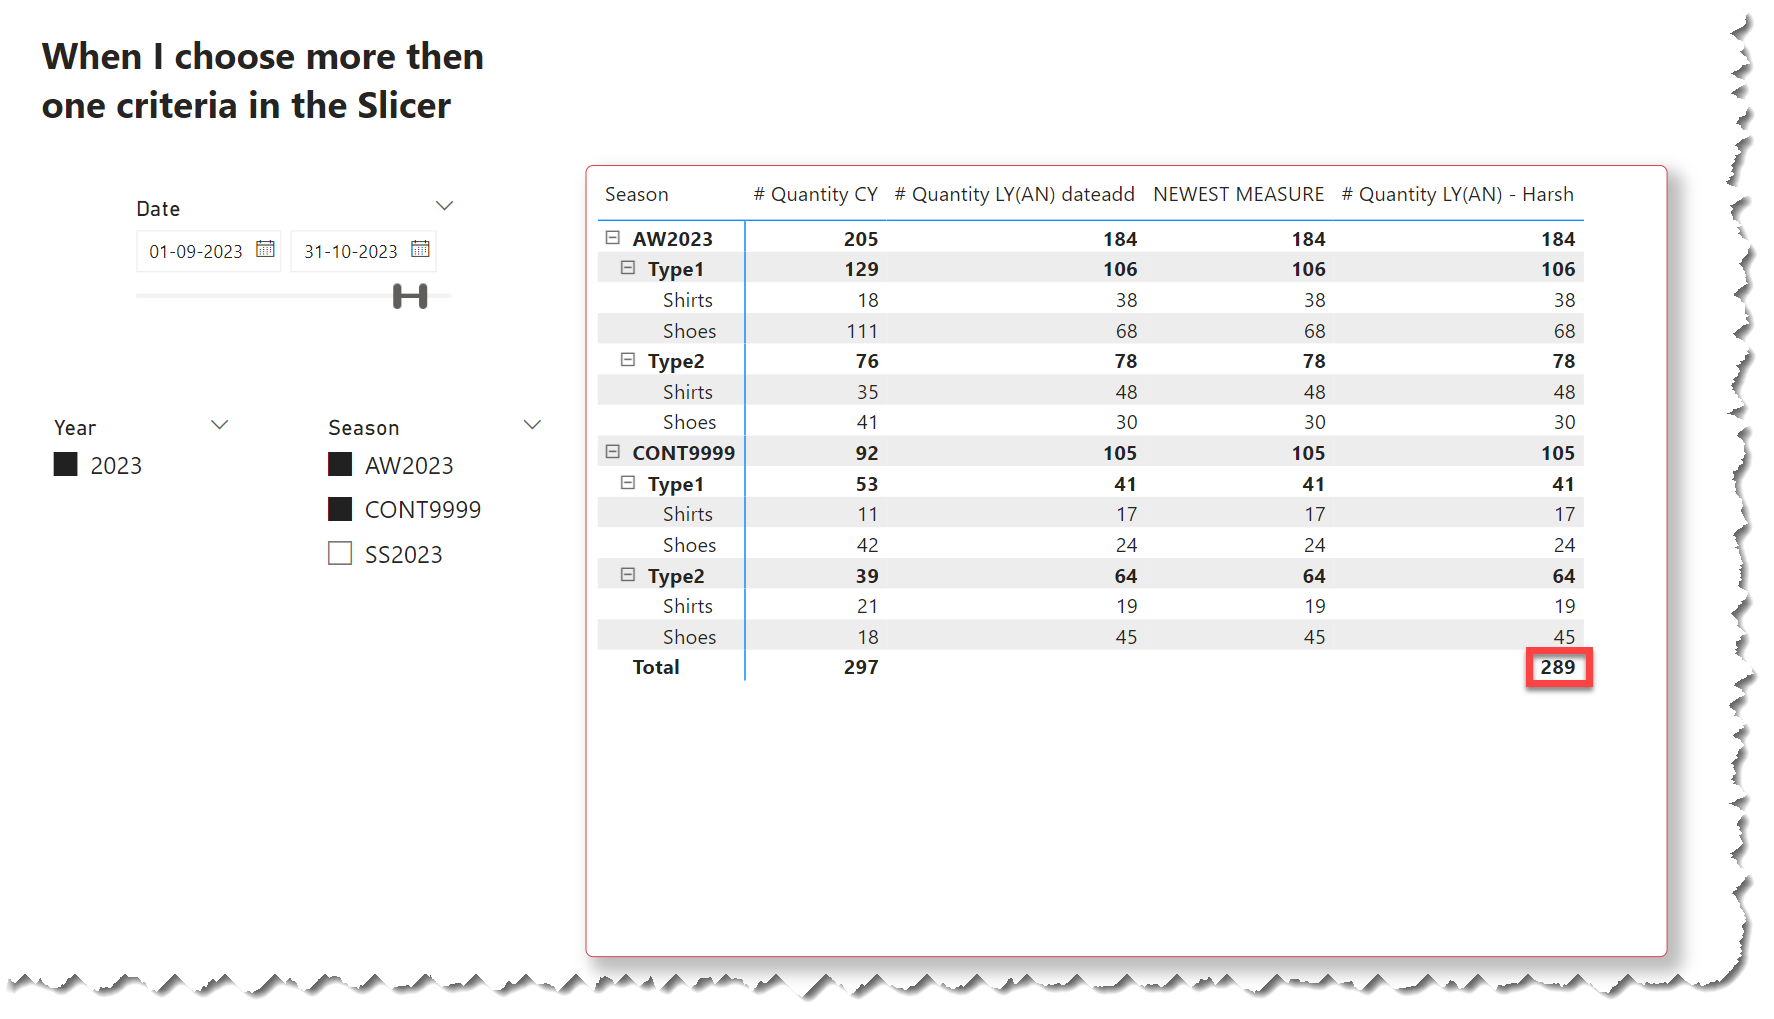
But, now I wanted to make selection wider using slicer and after selecting more than one criteria I loose Total.
Measure:
// NEWEST MEASURE =
VAR _season= SELECTEDVALUE(Figures[Season_Mark])
VAR _yr=SELECTEDVALUE(Figures[Season_Year])-1
VAR _qu=[# Quantity CY]
VAR _seasonkark =
SWITCH( TRUE() ,
_season = “CONT”, “CONT9999”,
_season&_yr
)
VAR _tot =
IF( ISBLANK([# Quantity CY]), BLANK(),
CALCULATE([# Quantity CY], FILTER( ALL(Figures[Season]), Figures[Season]
=_seasonkark), DATEADD( Dates[Date] , -364 , DAY ) )
)
return
if(ISFILTERED(Figures[Season]),_tot,[# Quantity LY])
//

It is only happening when I use Figures[Season] in the Slicer.

Thanks for any help on this.

Best
Sasa

Season LY V.2.pbix (155.6 KB)

Hello @sassaboss,

Thank You for posting your query onto the Forum.

In order to achieve the results based on the scenario that you’ve specified. Below is the measure alongwith the screenshot of the final results provided for the reference -

# Quantity LY(AN) - Harsh = 
VAR _Min_Season = 
MIN( Figures[Season_Mark] )

VAR _Max_Season = 
MAX( Figures[Season_Mark] )

VAR _Year = 
MAX( Figures[Season_Year] ) -1

VAR _Results = 
CALCULATE( [# Quantity CY] , 
    KEEPFILTERS( Figures[Season] = "CONT9999" ) , 
    DATEADD( Dates[Date] , -364 , DAY ) ) +

CALCULATE( [# Quantity CY] , 
    FILTER( ALL( Figures[Season] ) , 
        Figures[Season] <> "CONT9999" &&
        Figures[Season] >= _Min_Season & _Year &&
        Figures[Season] <= _Max_Season & _Year ) , 
    DATEADD( Dates[Date] , -364 , DAY ) )

RETURN
_Results

I’m also attaching the working of the PBIX file for the reference purposes.

Hoping you find this helpful and meets your requirements that you’ve been looking for.

Thanks and Warm Regards,
Harsh

Season LY V.2 - Harsh.pbix (158.9 KB)

1 Like

Great,

thank you very much.

Just one question. For example what if I have more than one non changing season, for example CONT and OLD.
Should the DAX code looks like this:

//
VAR _Results =
CALCULATE( [# Quantity CY] ,
KEEPFILTERS( Figures[Season] IN { “CONT9999”, “OLD9999” } ) ,
DATEADD( Dates[Date] , -364 , DAY ) ) +

Thanks for everything.

Kind regards,
Sasa