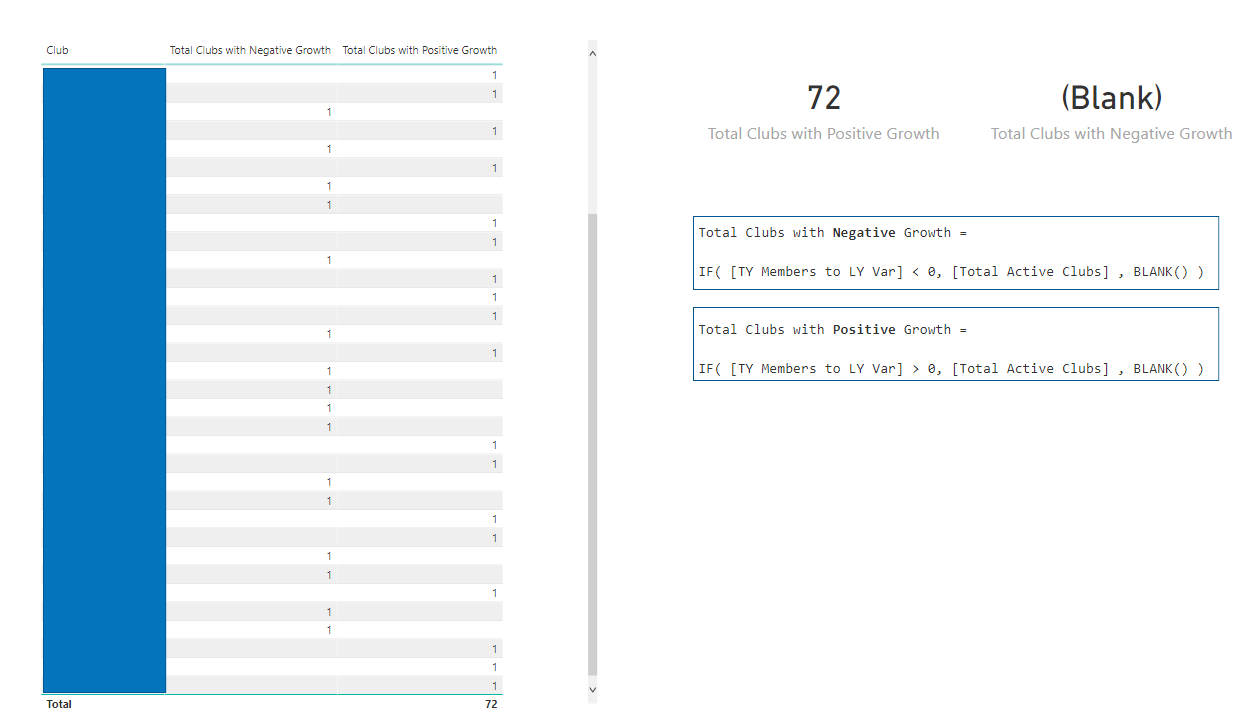
Hi, I’m trying to understand what is causing a different result from an IF statement when the only change in the statement is changing the >0 to <0. As per the result below.
The positive outcome produces a total where as the negative does not have a total.
It would certainly help to see the full file and the code for the branched measures, but even without it this is exactly the outcome I would have expected. Here’s the pseudo-code for what you’ve written:
If X < 0 then Y else Blank
if X > 0 then Y else Blank
Unless X exactly equals 0, then it can only be one or the other - i.e., greater than or less than 0. Depending on what X evaluates to, one of these statments will be equal to Y and one of them will be equal to Blank, which is exactly what you observe.
DAX is excellent at doing what you ASK it to do, less good at doing what you WANT it to do…
Think I understand what you said Brian. The result if the condition is met is a count of clubs, hence the result of 1. I was expecting it to sum the result for both statements.
Well, @BrianJ is been dealing with a family emergency and I hope you don’t mind I take a look at your query and assist you.
So if understand it correctly, you’re getting the results at an individual row level but the results which you’re getting at a “Grand Total” level is incorrect, right? Don’t worry about that we’ve already got you covered here. One of our expert @Greg had already created a specific post which exclusively addresses this type of query i.e. about how to fix the totals. I’m providing a link of the post below for the reference.
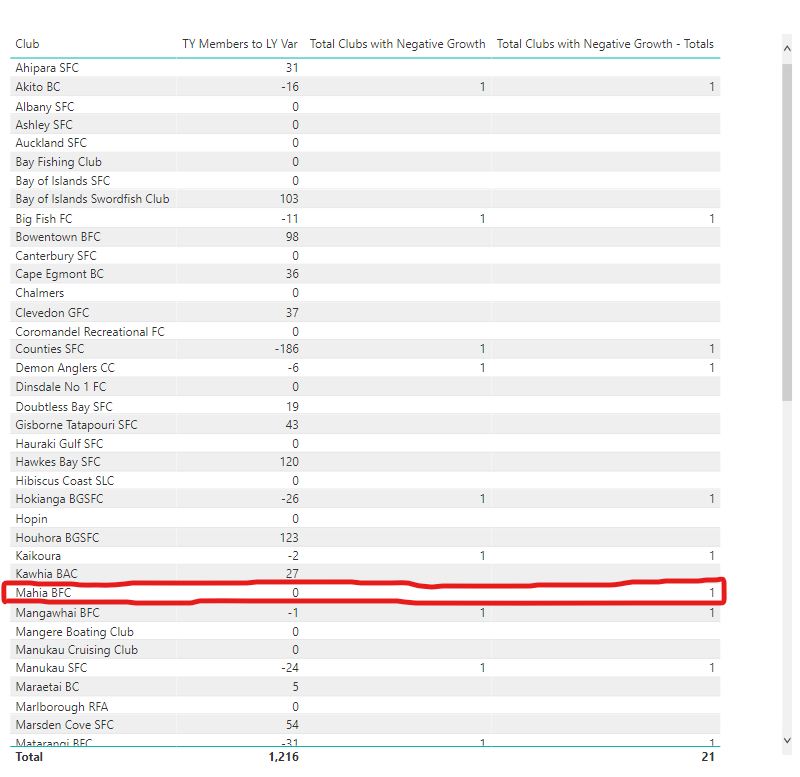
Also I observed that you’ve used the “Club” column from the Fact Table i.e. Members Table rather than referring it from the Dimension Table i.e Club Table itself. So when you write a measure to fix the totals of “Negative Growth” you’ll get the wrong results where an extra 1 is added which takes the totals tally to 21 rather than 20. Below is the screenshot of that provided for the reference -
So now, as I suggested replace the Club column from Members Table with the Club Table and write the below two measures provided as follows to fix your totals -
Total Clubs with Negative Growth - Totals =
SUMX(
    SUMMARIZE(
        'Club Data' ,
        'Club Data'[Club  ] ,
        "@Totals" ,
        [Total Clubs with Negative Growth] ) ,
    [@Totals]
)


Total Clubs with Positive Growth - Totals =
SUMX(
    SUMMARIZE(
        'Club Data' ,
        'Club Data'[Club  ] ,
        "@Totals" ,
        [Total Clubs with Positive Growth] ) ,
    [@Totals]
)
If you would like to calculate the totals virutally than writing an additional measure then adjust the context within it. Below are the measures provided for the reference -
Total Clubs with Negative Growth - Virtual =
VAR _Results_1 =
IF( [TY Members to LY Var] < 0 && [TY Members to LY Var] <> 0 ,
    [Total Active Clubs] ,
    BLANK() )


VAR _Results_2 =
ADDCOLUMNS(
    SUMMARIZE(
        'Club Data' ,
        'Club Data'[Club  ] ,
        "@Totals" ,
        IF( [TY Members to LY Var] < 0 && [TY Members to LY Var] <> 0 ,
            [Total Active Clubs] ,
            BLANK() ) ) ,
    "@Totals - Harsh" ,
    IF( [@Totals] > 0 ,
        1 ,
        BLANK() ) )

RETURN
IF(
    ISINSCOPE( 'Club Data'[Club  ] ) ,
    _Results_1 ,
    SUMX(
        _Results_2 , [@Totals - Harsh] ) )


Total Clubs with Positive Growth - Virtual =
VAR _Results_1 =
IF( [TY Members to LY Var] > 0 ,
    [Total Active Clubs] ,
    BLANK() )


VAR _Results_2 =
ADDCOLUMNS(
    SUMMARIZE(
        'Club Data' ,
        'Club Data'[Club  ] ,
        "@Totals" ,
        IF( [TY Members to LY Var] > 0 ,
            [Total Active Clubs] ,
            BLANK() ) ) ,
    "@Totals - Harsh" ,
    IF( [@Totals] > 0 ,
        1 ,
        BLANK() ) )

RETURN
IF(
    ISINSCOPE( 'Club Data'[Club  ] ) ,
    _Results_1 ,
    SUMX(
        _Results_2 , [@Totals - Harsh] ) )
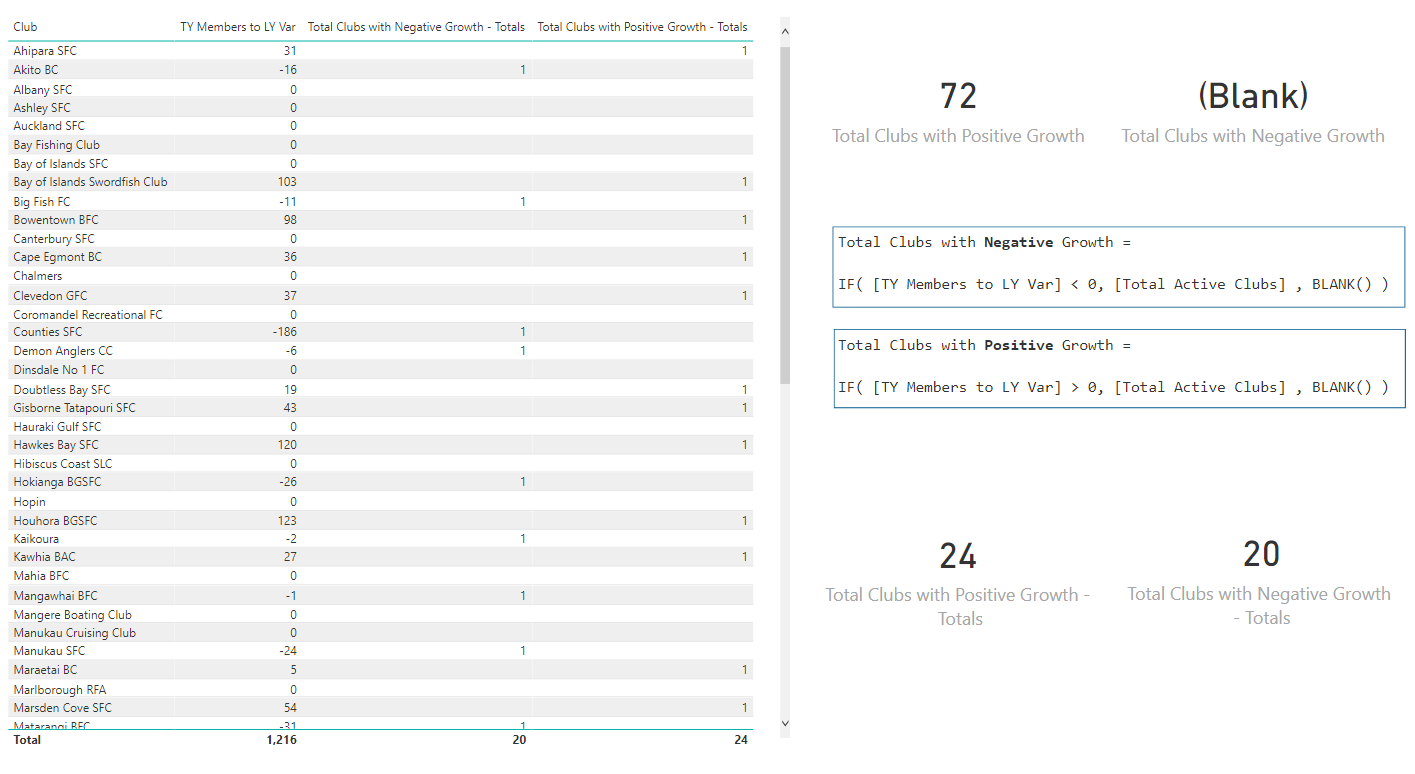
And now, you’ll observe that results of Negative Growth side is correct i.e. totals as 20 rather than 21. Below is the screenshot of the final results provided for the reference purposes.
Also when one writes the “IF()” or “SWITCH( TRUE() )” statement logic see how the results are evaluated at the back-end of the formula. One might think that their logic is correct but it doesn’t evaluates the results like that at a grand total level. I’m providing a link of one of the post where I’ve explained that logic to one of our forum member. Below is the link of that post provided for the reference purposes as well.
I’m also attaching the working of the PBIX file for the reference and link of the post which Greg had created to fix the totals.
Hoping you find this useful and meets your requirements that you’ve been looking for.
Note: In order to view the entire post, please click onto the link and not onto the “expand/collapse” button.
@Harsh@BrianJ , thank you guys. My biggest weakness is recognising when to use the correct method. I have been exposed to summarize during one of the many excellent Enterprise DNA programmes. Practice, practice, practice.