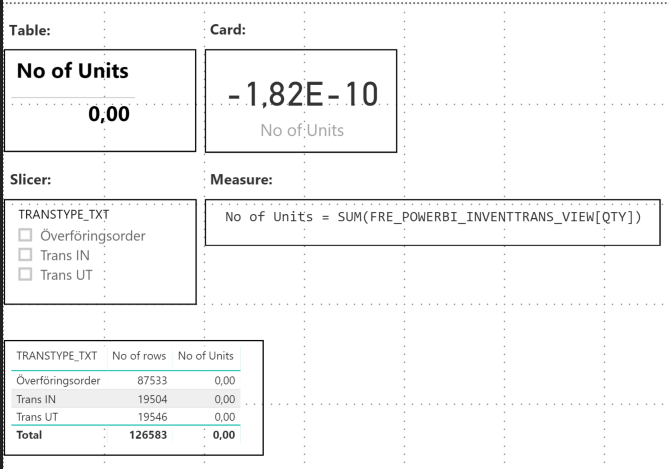
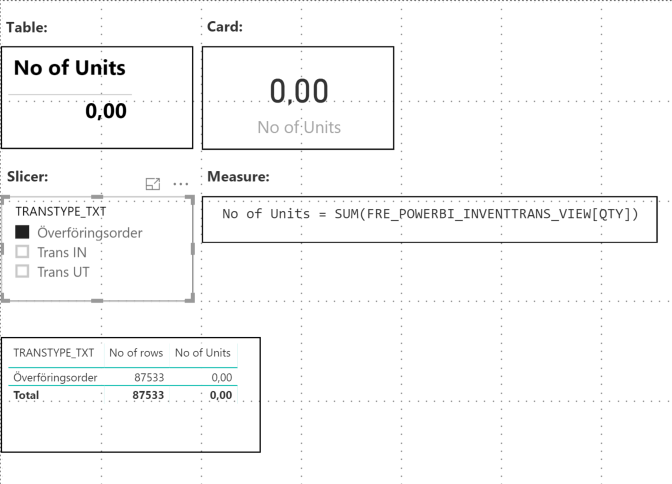
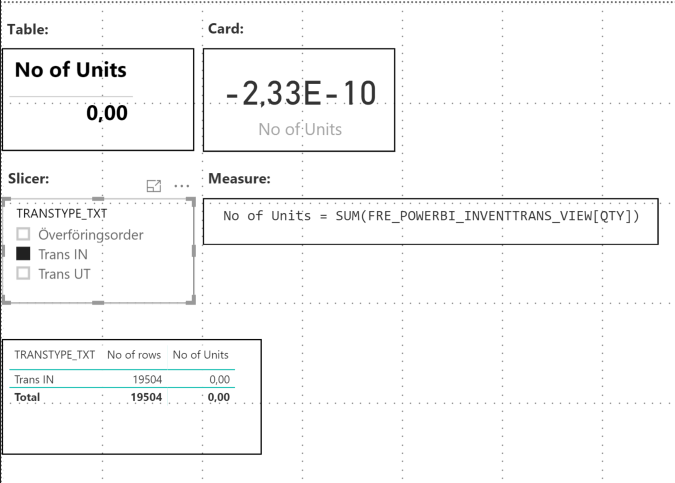
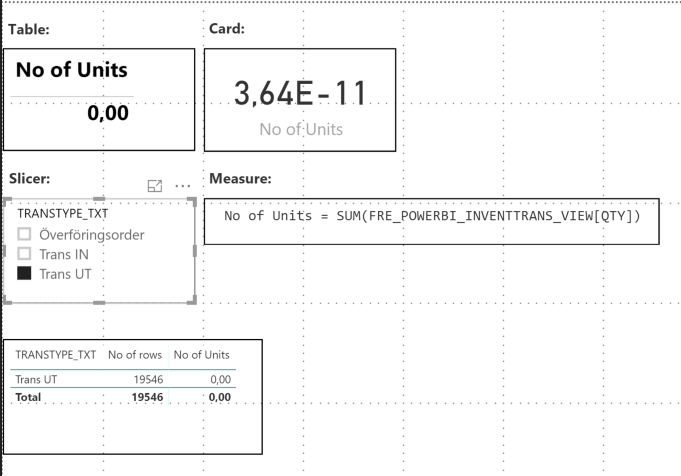
Hi, have problems that visualizations of card and table not showing the same results. I have a simple summary on a column of quantities, a measure and a slicer. the result should be 0 and table shows correct value but card shows strange numbers for 2 of the slicers values. I have checked that there is no junk in the data. How to handle this?


