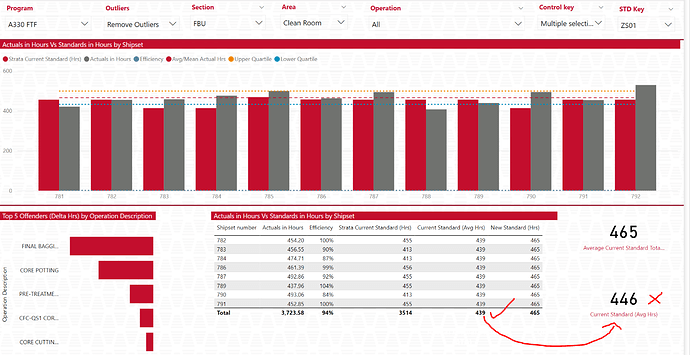
Different result in card than my table from dax formula

HI Guys,

I’m sure this will be an easy one for someone to explain to me and one of those where I have looked at it so long now I just can’t see straight!

Why does my column in the visual table " Current Standard (Avg Hours)" say the average is 439 of column Strata current standard (Hrs), which is correct but when I put the measure in a card, it says 446 hours which is incorrect?

Thanks

Dan

SS Sold_All Programs EDNA (Dan).pbix (2.5 MB)

Hi @Krays23 ,

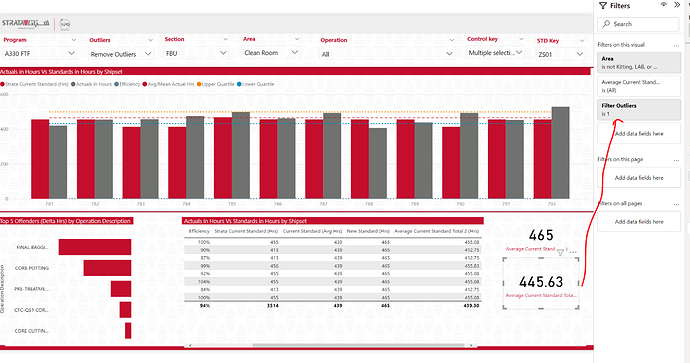
fresh pair of eyes - in table you have additional filters :

And in card not - so you have additional ship.number which are going into calculation.

Hope it helps.

HI

Thanks tried that still remains the incorrect total.

Its something to do with the outliers filter as the card doesn’t change when I switch the filter but the table does

bumping this post

Hello @Krays23,

Thank You for posting your query onto the Forum.

In order to achieve the results based on the scenario that you’ve mentioned in your initial post. Below is the DAX measure alongwith the screenshot of the final results provided for the reference -

Current Standard (Avg Hrs) - Card Numbers - Harsh = 
CALCULATE(
    AVERAGEX( VALUES( Sheet[Shipset number] ) ,
        [Strata Current Standard (Hrs)] ) , 
    FILTER( ALLSELECTED( Sheet[Shipset number] ) , 
        [Filter Outliers] = 1 ) )

I’m also attaching the working of the PBIX file for the reference purposes.

Hoping you find this useful and meets your requirements that you’ve been looking for.

Thanks and Warm Regards,
Harsh

SS Sold_All Programs EDNA (Dan) - Harsh.pbix (2.5 MB)

1 Like

Hi @Krays23 ,

Reason of this different result is in the context of Filter Outliers and the way how this measure is created

Filter Outliers = 
VAR CurrentSelection = SELECTEDVALUE('Is Outlier'[Selection])
VAR CurrentClass = [Is Outlier]
RETURN 
SWITCH(
    TRUE(),
    CurrentSelection = "Show Outliers Only" && CurrentClass = "Show Outliers Only", 1,
    CurrentSelection = "Remove Outliers" && CurrentClass = "Remove Outliers", 1,
    CurrentSelection = "All",1,
    0
)


based on

Is Outlier = 
    SWITCH(
        TRUE(),
        'Key Measures'[Actuals in Hours] < 'Key Measures'[Lower Quartile], "Show Outliers Only",
        'Key Measures'[Actuals in Hours] > 'Key Measures'[Upper Quartile], "Show Outliers Only",
        "Remove Outliers"
        )

So it depends of the context / environment of calculation.

In card is calculated based on totals.

So the table and your card give same results only if you choose Outliners = All

If you would like to include Filter Outliers in your card / Total context you need a change your measure little bit

TTEst Current Standard (Avg Hrs) = 
       CALCULATE(
              AVERAGEX(
                     FILTER (
                                   
                      ADDCOLUMNS(VALUES( Sheet[Shipset number] ), "@Filter_Outliers", [Filter Outliers]),
                     [@Filter_Outliers]=1)
              ,[Strata Current Standard (Hrs)]))

move [Filter Outliers] inside Averagex formula

You can check at pbix file:

SS Sold_All Programs EDNA (Dan)_Additional_measure.pbix (2.5 MB)

Hoping you find this useful and meets your requirements that you’ve been looking for.
Hello @Krays23 just following up if the response above help you solve your inquiry?

Please don’t forget if your question has been answered within the forum it is important to mark your thread as ‘solved’.