Me again… similar to my last post, but different…
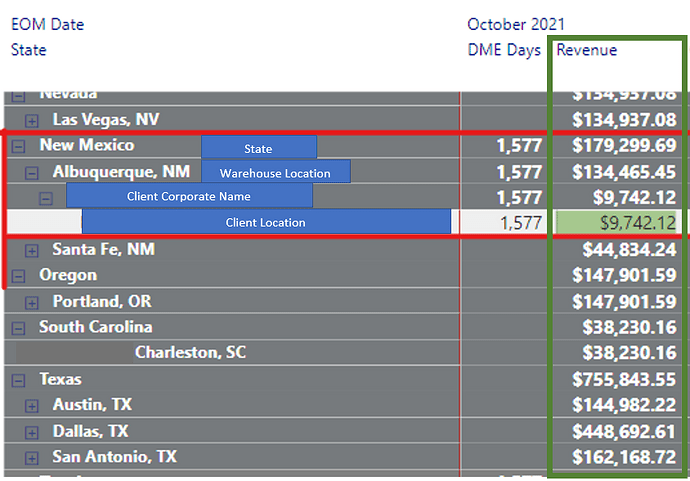
I have multiple datasets/tables pulling in revenue numbers each month. My matrix hierarchy consists of the following levels in this order:
–>State
–>Warehouse Location
–>Client Corporate Name
–>Client Location
I have several filters/slicers on the page to allow filtering down to a specific Warehouse Location, Client Corporate or Location, and Region (not a level in the matrix, but filter only).
Most of the time in a matrix if you filter down via slicer to the most granular level, the values returned in the matrix for that selection repeat down the same values, such as the column in my attached screenshot for “DME Days”.
What I Want: I want my Revenue to maintain and show the total respective values at each rollup/level in the hierarchy (as shown in my screenshot). HOWEVER, I only want the Warehouse Locations and States to show respective to the values I’ve selected in the slicer. You can see from my screenshot how Revenue is showing for all State and Warehouse levels, not just for the group associated with the Client Location I have selected in my slicer.
*I’ve also included a screenshot of the DAX I used to make the revenue show the correct values by level, but obviously I’m missing something. Can you someone take a look and see what’s going on? It could very well be that I used completely incorrect functions, but it was the only thing I could remotely get to work at all. I’ve looked at other functions like HasOneValue, RollUp/Summarize, IsFiltered, etc. but still no luck.
*One last problem. My measure for Revenue is being used in other pages of my report, including a summary page with 6 different line graphs. Ever since I modified the Revenue measure with the attached code, the line graphs with Revenue calculations show completely blank graphs.
I know this was a ton of information, so let me know if you need clarification or additional information. Unfortunately, I can’t send the PBIX file due to proprietary information.
Thank you!!
Daniel


