I need some input from the community as to a problem I’m conceptually struggling with. Seems like it pretty simple thing to solve, and I’ve tried various approaches to changing the filter context, but they’re all leading to expanded cross joins along the dates/property fields (and me banging my head against a wall).
Goal = define a baseline measure that shows the value of the [Site Energy Use (kBtu] where the [Energy Baseline] = True.
There are two slicers around the [RCH_Unique_ID]/[Property Name] and the Calendar ([Reporting Date]) and the baseline should show across all dates <= the last date being sliced.
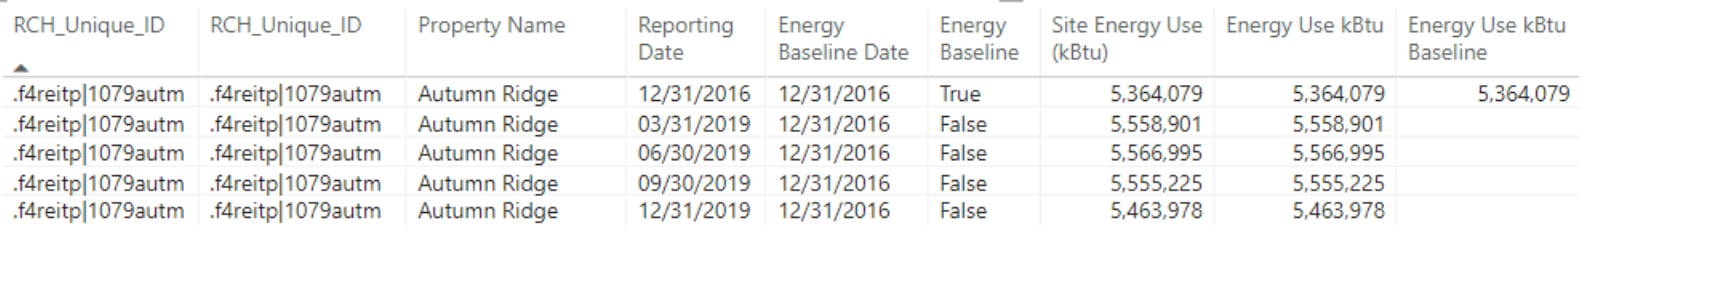
The first six columns show the underlying data columns. The first measure is called [Energy Use kBtu] and defined correctly, showing the correct amounts when filtered.
[Energy Use kBtu Baseline] shows correctly only for the record where the baseline value is true ( [Energy Baseline]=True ). This is the value that should be returned for all dates <= [Last selected date].
I’ve tried various approaches to overriding the filter context, but as i mention these all have lead to including additional dates as part of the calculation.
Including an excel document with the underlying data above.
Energy Data.xlsx (11.6 KB)
I would add a disconnected date table that doesn’t have any relationships to any of the data. The [Energy Use kBtu Baseline] uses this disconnected date table to filter and in turn is filtered by the the slicer itself.
Energy Use kBtu Baseline =
VAR CurrentPeriod = MAX('Dates'[Date])

    RETURN
        CALCULATE( IF([Energy Baseline] = TRUE(), [Site Energy Use (kBtu)]),
    	    FILTER( ALL( 'DisconnectedDate' ),
    		    'DisconnectedDate'[Date] <= CurrentPeriod  ) )
1 Like
Hi @kevin.vertrees, did the response provided by @bradsmith help you solve your query? If not, how far did you get, and what kind of help you need further? If yes, kindly mark the thread as solved. Thanks!
Hi @kevin.vertrees, we’ve noticed that no response has been received from you since the 16th of November. We just want to check if you still need further help with this post? In case there won’t be any activity on it in the next few days, we’ll be tagging this post as Solved. If you have a follow question or concern related to this topic, please remove the Solution tag first by clicking the three dots beside Reply and then untick the checkbox. Thanks!
Thanks for the response Brad. I’ll need to model and test this out to see if solve the problem, which i’m hoping to get into this morning.
I guess my fundamental question is why does it need this table? Couldn’t is just use the existing calendar table, but override the filter context on the calendar so that it includes all dates <= last selected date?
It’s because as long as their is a relationship between the two date fields (i.e. the Calendar Date field and the Reporting Date field) Power BI views that as the same Date field and thus are always using the same filter context. If there is no relationship between the calendar and the data table, but the disconnected date table allows the table to slice the data based on a specific set of values and control what is displayed based on the values selected. Yes, it is technically possible to create a single measure to do all this, but a disconnected date table is far simpler in my opinion.
1 Like
A response on this post has been tagged as “Solution”. If you have a follow question or concern related to this topic, please remove the Solution tag first by clicking the three dots beside Reply and then untick the check box. Thanks!
Brad - as an update to this, I did eventually implement a disconnected date slicer and it all makes sense to me now. Was a little beyond my reach initially, but as with all the other tips and tricks, but has allowed the ability to show different time periods for different visuals on the same report, which the single calendar slicing was not allowing. Cheers!
1 Like