Hi all,
Can anyone point me in the direction of a really good/detailed waterfall chart help, because i’m really struggling at this point.
Issue 1
Anchoring Waterfall.
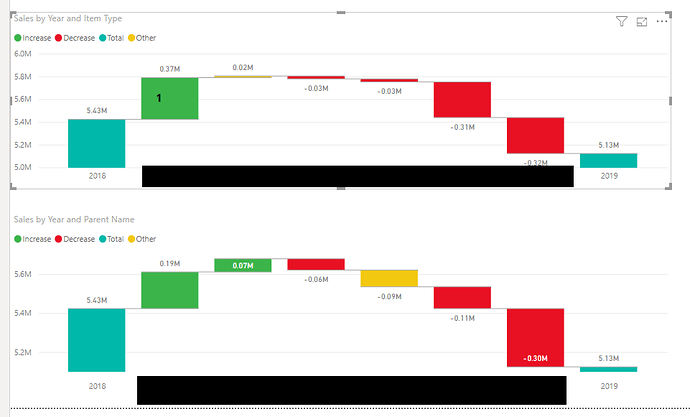
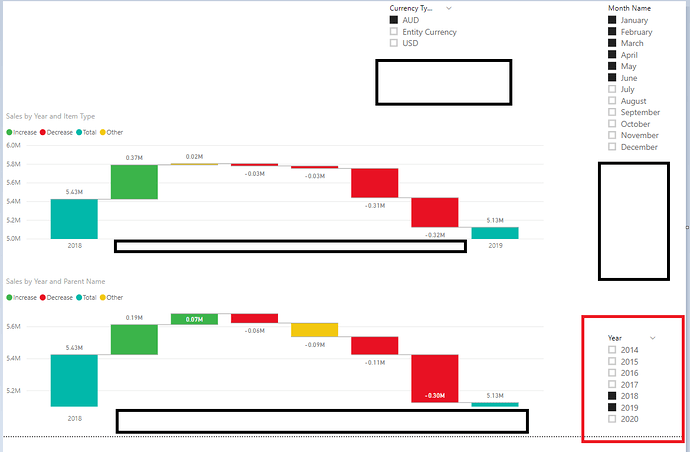
The below waterfalls show movement between 2018 & 2019 actuals across various product types and customer names. So far so good.
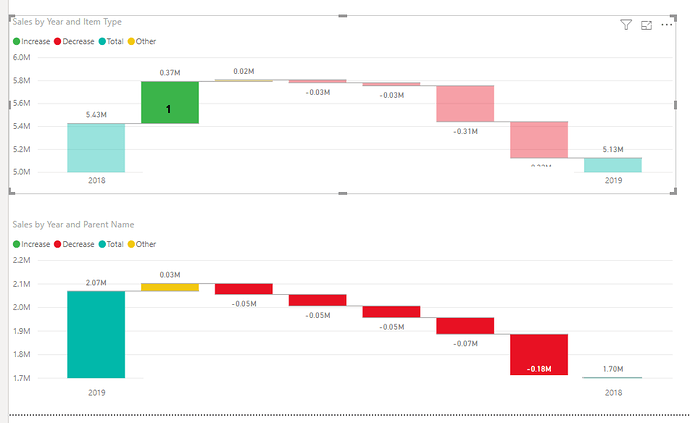
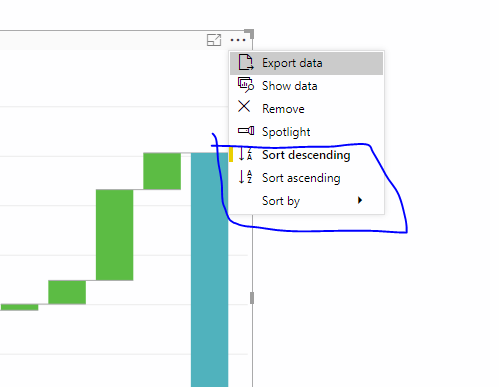
If i click on the green item on the Sales by Year and Item Type Number 1 i get a strange behaviour where the years have swapped over on the Sales by Year and Parent name as the year 2019 is now displayed first.
I’m confused by the result and I couldn’t possibly unleash this onto my users:
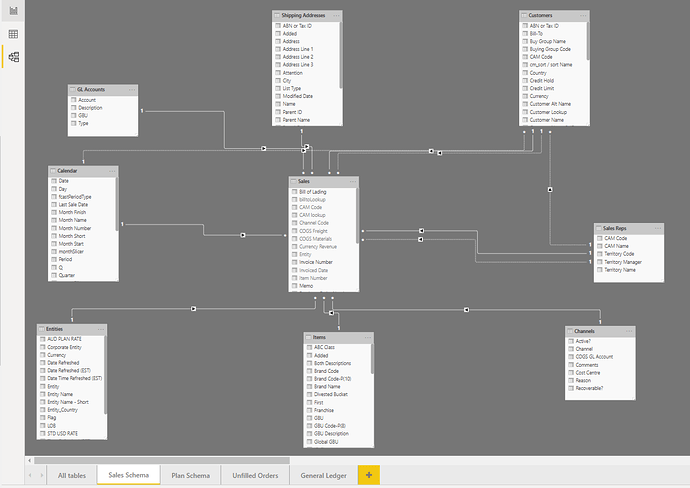
The sales schema is straight forward star; ignore the secondary relationships as they aren’t used in this one.
Anybody know why? I’m hoping this is a fairly simple error on my part.
Issue 2
I’m at a loss on how to use a waterfall for a standard business case, comparing say a current Budget (Plan) against a new Forecast for the same period.
To get the above to work i had to manually select both years but it was the same underlying measure [Sales].
How would you go about comparing multiple measures, for example [Sales] for a selected year vs [Budget] for selected year +1?
or Forecast No 1 vs Forecast No 2.
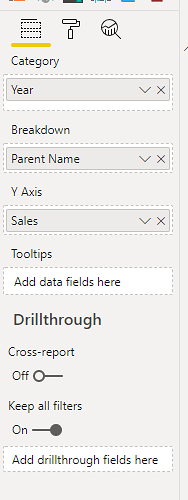
The waterfall is set up as
This has got me stumped. the advice i’ve got in the past on these forums has been great; so I’m really hoping that you all can come to the party on this one.
