Deneb Workout 08 - Dumbbell Chart

Difficulty Rating: 2 out of 5
Deneb Workout 08 - Dumbbell Chart

A dumbbell chart can be created in Power BI using Deneb/Vega-Lite. This workout presents an example, where we see ranged and coloured bars and endpoints.

Goals
Using the PBIX loaded with the Enterprise DNA Practice Dataset supplied, produce a Deneb visual in Power BI that:
• uses ranged and coloured horizontal bars to depict the current-to-previous year variance
• uses coloured symbols at the bar ends for the CY and PY measures
• includes in-visual variance calculations
• includes a legend for the CY and PY measures
• includes a custom tooltip using Power BI formatting
• includes a title block with subtitle

Submission
Using the supplied Power BI file as the data source/starting point, create your solution, and reply to this post. Upload a screenshot of your solution along with the Deneb/Vega-Lite JSON code used. Please format your JSON code and blur it or place it in a hidden section.

Period
This workout will be released on Monday May 22, 2023, will run for 2 weeks, and the author’s solution will be posted on Sunday June 4, 2023.

Greg
Deneb Workout 08 - Data - Enterprise DNA Practice Dataset.pbix (1.7 MB)

1 Like

Hello! Here is my try… I was not able to get the legend correctly, nor to have the rule mark change color when I switch year… the rest looks OK :slight_smile:
And let me thank you for these workouts! On top of improving my knowledges, they are immediately applicable to my reports as well - which now look so much better!

Kind regards
Valeria

Spec

{
“data”: {“name”: “dataset”},
“title”: {
“text”: “Deneb Workout 08”,
“anchor”: “start”,
“subtitle”: “Dunbell Chart”
},
“transform”: [
{
“calculate”: “(-datum[‘Sales CY’]+ datum[‘Sales PY’])”,
“as”: “Difference”
},
{
“calculate”: “(-datum[‘Sales CY’]+ datum[‘Sales PY’])/datum[‘Sales PY’]”,
“as”: “%_Difference”
}
],
“layer”: [
{
“mark”: {
“type”: “rule”,
“strokeWidth”: 2
},
“encoding”: {
“x”: {
“field”: “Sales CY”,
“type”: “quantitative”,
“axis”: {
“title”: “Annual Sales”,
“formatType”: “pbiFormat”,
“format”: “$#,##0;($#,##0)”,
“tickCount”: 5
}
},
“x2”: {“field”: “Sales PY”},
“color”: {
“field”: “Year”,
“type”: “ordinal”,
“scale”: {
“scheme”: “pbiColorNominal”
},
“legend”: null
}
}
},
{
“mark”: {“type”: “point”},
“encoding”: {
“x”: {
“field”: “Sales CY”,
“type”: “quantitative”
},
“color”: {“value”: “#03027c”}
}
},
{
“mark”: {“type”: “point”},
“encoding”: {
“x”: {
“field”: “Sales PY”,
“type”: “quantitative”
},
“color”: {“value”: “#88ceec”}
}
}
],
“encoding”: {
“y”: {
“field”: “Country”,
“type”: “nominal”
},
“tooltip”: [
{“field”: “Country”},
{
“field”: “Sales CY”,
“formatType”: “pbiFormat”,
“format”: “$#,##0;($#,##0)”
},
{
“field”: “Sales PY”,
“formatType”: “pbiFormat”,
“format”: “$#,##0;($#,##0)”
},
{
“field”: “Difference”,
“formatType”: “pbiFormat”,
“format”: “$#,##0;($#,##0)”
},
{
“field”: “%_Difference”,
“title”: “% Difference”,
“formatType”: “pbiFormat”,
“format”: “#%”
}
]
}
}

Hi @valeriabreveglieri. Thanks for the kind words, and I’m glad you’re finding the workouts useful. I’ll address your specific issues when I post my solution on Sunday.
Greg

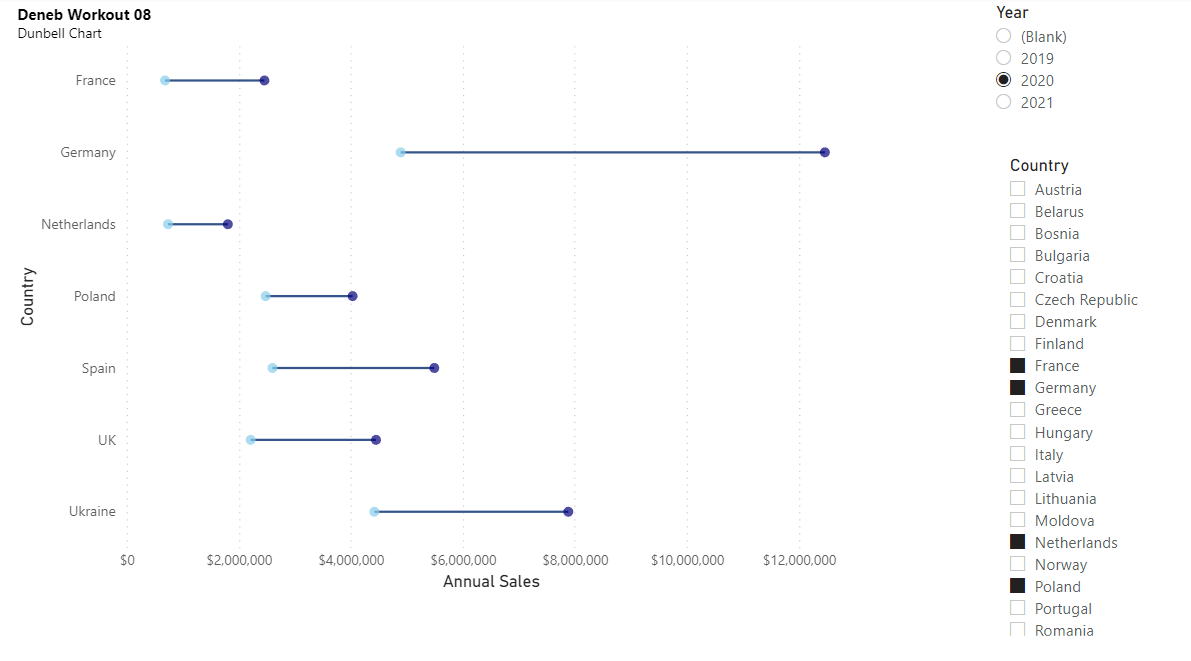
Here’s my solution to this workout, where I used several Deneb/Vega-Lite features, including:

General:

• used a title block complete with subtitle
• used a transform block to extend the dataset with difference and percent difference calculations
• used a vconcat block to display the composite visual 2 (separate legend and dumbbell chart)

Legend:

• used hard-coded data values (instead of the default [normal] Power BI “dataset”)
• used an ARC mark of radius zero as the visual itself was not desired, just the legend
• used a color block with hard-coded values to both be consistent with the dumbbell chart and to position and configure the legend

Dumbbell Chart:

• used a RULE mark with colour conditional on the difference field to display the “bar” portion of the dumbbell
• used separate CIRCLE marks for the CP and PY to display the “end” portions of the dumbbell
• used a shared encoding block (outside the layer block) for both the Country (y-axis) and the tooltip

Here’s the code:

{
  "title": {
    "anchor": "start",
    "align": "left",
    "offset": 10,
    "text": "Deneb Workout 08",
    "font": "Verdana",
    "fontSize": 16,
    "fontWeight": "bold",
    "fontStyle": "normal",
    "subtitle": "Dumbbell Chart",
    "subtitleFont": "Verdana",
    "subtitleFontSize": 12,
    "subtitleFontWeight": "normal",
    "subtitleFontStyle": "italic"
  },
  "data": {"name": "dataset"},
  "transform": [
    {
      "calculate": "datum['Sales CY'] - datum['Sales PY']",
      "as": "_sales_difference"
    },
    {
      "calculate": "datum['_sales_difference'] / datum['Sales PY']",
      "as": "_sales_difference_percent"
    }
  ],
  "vconcat": [
    {
      "name": "LEGEND",
      "width": 800,
      "height": 1,
      "data": {
        "values": [
          {
            "legend_id": 1,
            "legend_size": 1,
            "legend_label": "Previous Year"
          },
          {
            "legend_id": 2,
            "legend_size": 1,
            "legend_label": "Current Year"
          }
        ]
      },
      "mark": {
        "type": "arc",
        "radius": 0
      },
      "encoding": {
        "theta": {
          "field": "legend_size",
          "type": "quantitative"
        },
        "color": {
          "field": "legend_label",
          "type": "nominal",
          "scale": {
            "domain": [
              "Current Year",
              "Previous Year"
            ],
            "range": ["navy", "skyblue"]
          },
          "legend": {
            "orient": "top-left",
            "direction": "horizontal",
            "title": null,
            "offset": 0,
            "labelColor": "black",
            "labelFont": "Segoe UI",
            "labelFontSize": 12,
            "labelFontStyle": "italic",
            "symbolSize": 200,
            "symbolType": "circle"
          }
        }
      }
    },
    {
      "name": "DUMBBELL_CHART",
      "encoding": {
        "y": {
          "field": "Country",
          "type": "nominal",
          "sort": {
            "op": "sum",
            "field": "Sales CY",
            "order": "descending"
          },
          "title": null
        },
        "tooltip": [
          {
            "field": "Country",
            "type": "nominal"
          },
          {
            "field": "Sales CY",
            "type": "quantitative",
            "formatType": "pbiFormat",
            "format": "$#,##0;($#,##0)"
          },
          {
            "field": "Sales PY",
            "type": "quantitative",
            "formatType": "pbiFormat",
            "format": "$#,##0;($#,##0)"
          },
          {
            "field": "_sales_difference",
            "type": "quantitative",
            "title": "Difference",
            "formatType": "pbiFormat",
            "format": "$#,##0;($#,##0)"
          },
          {
            "field": "_sales_difference_percent",
            "type": "quantitative",
            "title": "% Difference",
            "formatType": "pbiFormat",
            "format": "#%"
          }
        ]
      },
      "layer": [
        {
          "name": "RULE",
          "height": 480,
          "width": 800,
          "mark": {
            "type": "rule",
            "strokeWidth": 5
          },
          "encoding": {
            "x": {
              "field": "Sales PY",
              "type": "quantitative",
              "title": "Annual Sales",
              "axis": {
                "format": "$#,0",
                "formatType": "pbiFormat",
                "tickCount": 6
              }
            },
            "x2": {"field": "Sales CY"},
            "color": {
              "condition": {
                "test": "datum['_sales_difference'] < 0",
                "value": "red"
              },
              "value": "green"
            }
          }
        },
        {
          "name": "CIRCLE_PY",
          "mark": {
            "type": "circle",
            "size": 200,
            "color": "skyblue",
            "opacity": 1
          },
          "encoding": {
            "x": {
              "field": "Sales PY",
              "type": "quantitative"
            }
          }
        },
        {
          "name": "CIRCLE_CY",
          "mark": {
            "type": "circle",
            "size": 200,
            "color": "navy",
            "opacity": 1
          },
          "encoding": {
            "x": {
              "field": "Sales CY",
              "type": "quantitative"
            }
          }
        }
      ]
    }
  ]
}

Congratulations to all who participated, and good luck.
Greg
Deneb Workout 08 - Dumbbell Chart.pbix (1.7 MB)

1 Like