Here’s my solution to this workout, where I used several Deneb/Vega-Lite features, including:
• used a title block complete with subtitle
• used a params block to create a parameter bound to the axes (scales) [roll the mouse wheel while holding the SHIFT key to pan; CTRL key to zoom]
• used a circle mark with border colour (stroke) set to black
• used a temporal type for the X-encoding block with a timeunit: month key-value pair to have Vega-Lite automatically calculate the X-axis and labels
• used an offset of 5 pixels to create a small amount of space between the circles and the Y-axis
• used the clipHeight property to adjust the spacing of the legend
• used the rangeMax property to adjust the symbol size used in the legend
• used the Deneb pbiColorNominal scheme to access the colours of the current Power BI theme
• used a custom tooltip with Deneb’s access to Power Bi formatting strings
Here’s the code:
{
"title": {
"anchor": "start",
"align": "left",
"offset": 10,
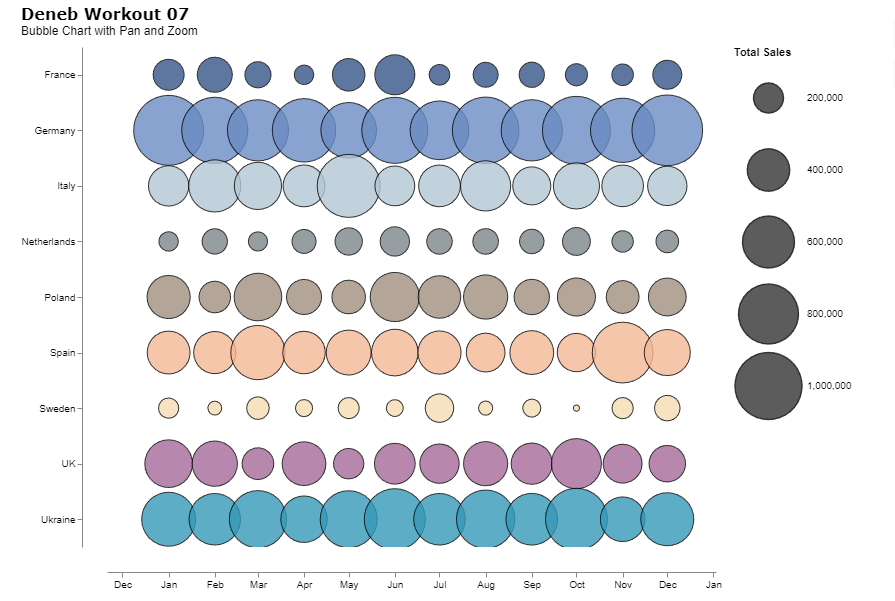
"text": "Deneb Workout 07",
"font": "Verdana",
"fontSize": 16,
"fontWeight": "bold",
"fontStyle": "normal",
"subtitle": "Bubble Chart with Pan and Zoom",
"subtitleFont": "Verdana",
"subtitleFontSize": 12,
"subtitleFontWeight": "normal",
"subtitleFontStyle": "italic"
},
"data": {"name": "dataset"},
"params": [
{
"name": "_pan_and_zoom",
"select": "interval",
"bind": "scales"
}
],
"mark": {
"type": "circle",
"tooltip": true,
"opacity": 0.8,
"stroke": "black",
"strokeWidth": 1
},
"encoding": {
"x": {
"field": "Month Middle",
"type": "temporal",
"timeUnit": "month",
"axis": {
"title": null,
"grid": false,
"offset": 5
}
},
"y": {
"field": "Country",
"type": "nominal",
"axis": {
"title": null,
"offset": 5
}
},
"size": {
"field": "Total Sales",
"type": "quantitative",
"legend": {"clipHeight": 70},
"scale": {"rangeMax": 5000}
},
"color": {
"field": "Country",
"type": "nominal",
"legend": null,
"scale": {
"scheme": "pbiColorNominal"
}
},
"tooltip": [
{"field": "Country"},
{
"field": "Month Middle",
"title": "Month",
"format": "MMMM",
"formatType": "pbiFormat"
},
{
"field": "Month Middle",
"title": "Year",
"format": "yyyy",
"formatType": "pbiFormat"
},
{
"field": "Total Sales",
"format": "$#,##0.",
"formatType": "pbiFormat"
}
]
}
}
Note: I used a DAX formula to adjust the Total Sales amounts for better visibility on the Deneb/Vega-Lite visual. The code is:
Total Sales (Factored) =
VAR _Month = SELECTEDVALUE( Dates[MonthOfYear] )
VAR _Result = SWITCH( TRUE(),
    _Month IN {4,5,11}, [Total Sales] * 2,
    [Total Sales] * 0.5)

RETURN
_Result
Congratulations to all who participated, and good luck.
Greg
Deneb Workout 07 - Bubble Chart with Pan and Zoom.pbix (1.7 MB)