Difficulty Rating: 2 out of 5
Visuals can be linked in Power BI using Deneb/Vega-Lite. A section can be highlighted (selected) in one visual, for example, and a second visual can be filtered by the selection in the first. This workout presents such an example.
Goals
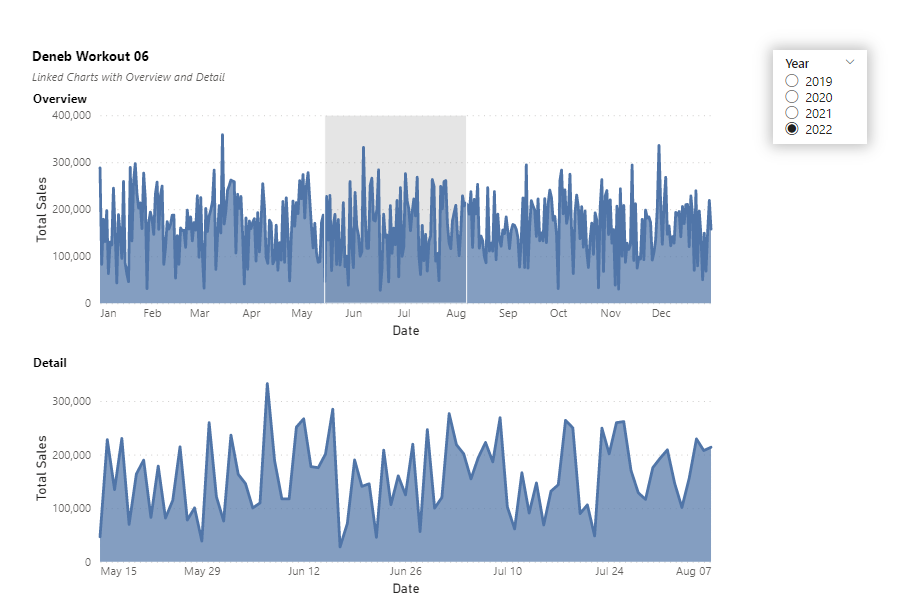
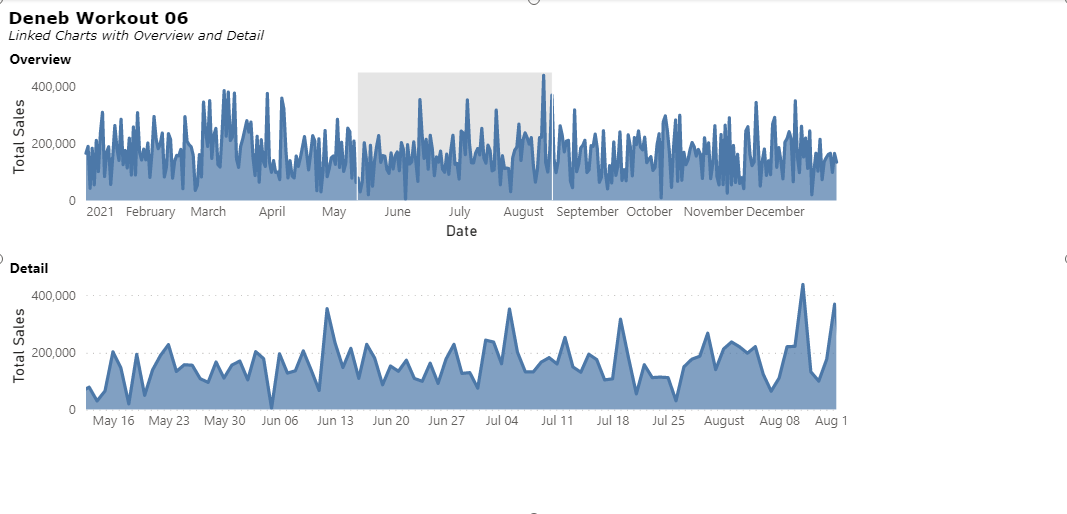
Using the PBIX loaded with the Enterprise DNA Practice Dataset supplied, produce a single Deneb visual with two vertically concatenated component visuals in Power BI that:
General:
• includes a title block with subtitle
Overview:
• includes an area chart with in-visual title
• includes a selection brush for the date range
Detail:
• includes an area chart with in-visual title
• includes a transform block to filter the visual based on the date range selected by the selection brush
Submission
Load the supplied data file into a new Power BI file, create your solution, and reply to this post. Upload a screenshot of your solution along with the Deneb/Vega-Lite JSON code used. Please format your JSON code and blur it or place it in a hidden section.

Period
This workout will be released on Monday April 24, 2023, will run for 2 weeks, and the author’s solution will be posted on Sunday May 7, 2023.
Greg
Deneb Workout 06 - Data - Enterprise DNA Practice Dataset.pbix (1.7 MB)