Deneb Workout 04 - Waffle Chart

Difficulty Rating: 3 out of 5

Deneb Workout 04 - Waffle Chart

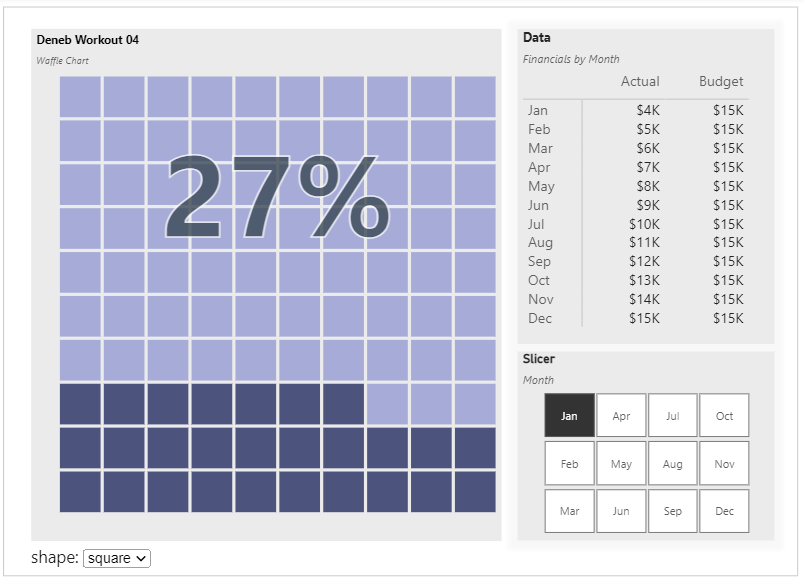
A waffle chart can be used to illustrate a KPI as a percentage. Deneb/Vega-Lite can be used to easily create the desired base shape using a custom dataset (for such a chart, a 10x10 grid) and enables the layering of multiple marks.

Goals
Using the simple supplied dataset, produce a circular chart Deneb visual in Power BI that:
• consists of 2 overlapping marks (point, text)
• includes a transform block with in-visual calculations to extend the dataset
• includes a parameters block to create non-dataset values and calculations for reuse
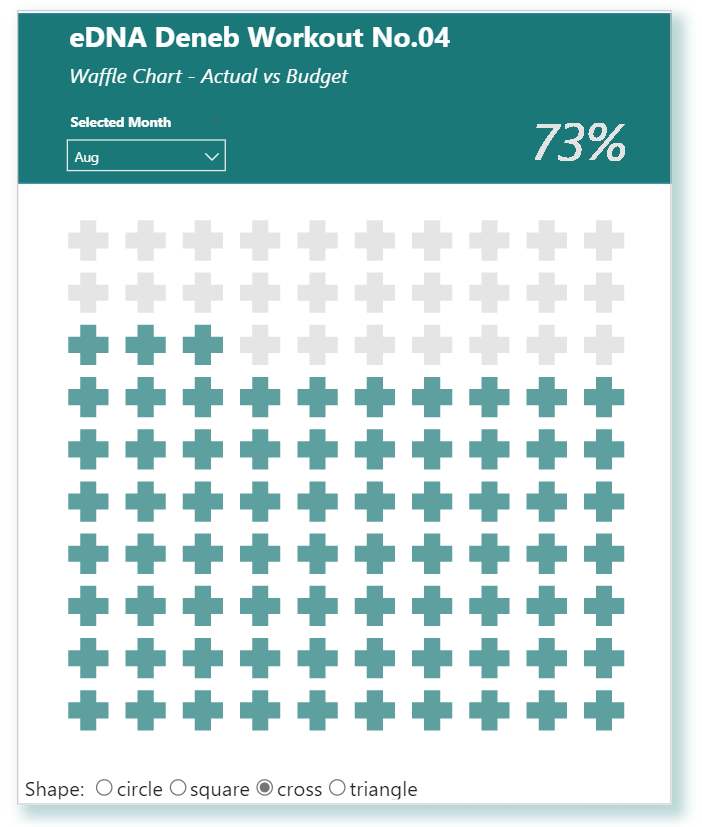
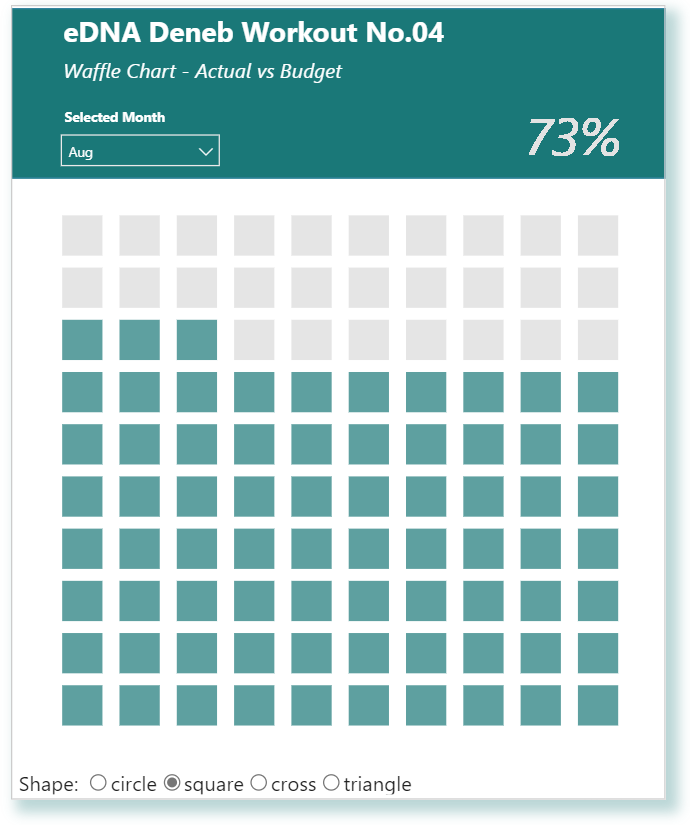
• includes an input widget for waffle marker shape change
• colours the point mark as per the current Power BI theme colour 1
• colours the text mark with white border and black fill to remain clear no matter the point mark colour
• includes a title block with subtitle

Submission
Load the supplied data file into a new Power BI file, create your solution, and reply to this post. Upload a screenshot (animated GIF, if possible) of your solution along with the Deneb/Vega-Lite JSON code used. Please format your JSON code and blur it or place it in a hidden section.

This workout will be released on Monday April 10, 2023, and the author’s solution will be posted on Sunday April 16, 2023.

Greg
Deneb Workout 04 - Data - Actual vs Budget.xlsx (9.0 KB)
Deneb Workout 04 - Data - 10x10_grid.xlsx (10.5 KB)

2 Likes

I was not sure if the “blur” was working in previous post :slight_smile:

Here’s my solution to this workout, where I used several Deneb/Vega-Lite features, including:

  • • title block complete with subtitle
  • • used a transform block to extend the dataset by performing in-visual calculations to calculate the cell number, round the percent value, and convert the rounded percent value to a decimal
  • • used a params block to enhance the dataset with a waffle shape: radio-button input widget
  • • used a layer block with 2 marks (in background-to-foreground order):
    • • waffle (scatter-plot using point mark, shape as selected from the waffle shape widget, Power BI theme colour 8 for cell numbers below or equal to the percent and Power BI theme colour 1 for cell numbers above the percent
    • • percent value (text mark, black colour with white “halo”, and Power BI percent formatting)

Here’s the code:

{
  "title": {
    "anchor": "start",
    "align": "left",
    "offset": 10,
    "text": "Deneb Workout 04",
    "font": "Verdana",
    "fontSize": 16,
    "fontWeight": "bold",
    "fontStyle": "normal",
    "subtitle": "Waffle Chart",
    "subtitleFont": "Verdana",
    "subtitleFontSize": 12,
    "subtitleFontWeight": "normal",
    "subtitleFontStyle": "italic"
  },
  "data": {"name": "dataset"},
  "height": 410,
  "width": 400,
  "transform": [
    {
      "calculate": "((datum['Row'] - 1) * 10 ) + datum['Column']",
      "as": "_cell"
    },
    {
      "calculate": "round(datum['Percent'], 0)",
      "as": "_rounded_percent"
    },
    {
      "calculate": "datum['_rounded_percent'] / 100",
      "as": "_rounded_decimal"
    }
  ],
  "params": [
    {
      "name": "_waffle_shape",
      "value": "circle",
      "bind": {
        "input": "radio",
        "options": ["circle", "square"],
        "name": "waffle shape: "
      }
    }
  ],
  "layer": [
    {
      "name": "WAFFLE",
      "mark": {
        "type": "point",
        "size": 1000,
        "shape": {
          "expr": "_waffle_shape"
        }
      },
      "encoding": {
        "x": {
          "field": "Column",
          "type": "quantitative",
          "axis": {
            "title": "Actual vs. Budget",
            "labels": false
          }
        },
        "y": {
          "field": "Row",
          "type": "quantitative",
          "axis": null
        },
        "color": {
          "condition": [
            {
              "test": "datum['_rounded_percent'] < datum['_cell']",
              "value": {
                "expr": "pbiColor(0)"
              }
            }
          ],
          "value": {
            "expr": "pbiColor(7)"
          },
          "legend": null
        }
      }
    },
    {
      "name": "LABEL",
      "mark": {
        "type": "text",
        "fill": "black",
        "stroke": "white",
        "fontSize": 60,
        "fontWeight": "bold",
        "xOffset": 20,
        "yOffset": -180
      },
      "encoding": {
        "text": {
          "field": "_rounded_decimal",
          "type": "quantitative",
          "formatType": "pbiFormat",
          "format": "#%"
        }
      }
    }
  ]
}

Congratulations to all who participated, and good luck.
Greg
Deneb Workout 04 - Waffle Chart.pbix (1.4 MB)

1 Like

Thanks Greg,
I just completed your course on eDNA, and was looking for some resources to help continue the journey, so these are a great help.

I still needed your code to create the overall solution, but used it as an opportunity to explore some additional formatting options on shape type, locating the main percentage number, adjusting color types, etc.

I was trying to create an additional parameter bar at the bottom to allow the selection of the month. I could create the dropdown, but was having issues creating the link to the main data. Something I will try and work on in the future, or something you could maybe provide a pointer on?

Thanks again, and looking forward to trying more out.


Hi @GerardDuggan. Thanks for your kind words, and I’m glad your found both the course and these workouts illuminating. As for your question on an additional parameter for month selection, this illustrates one of the characteristics of custom visuals as I understand it, in that Microsoft only allows a single dataset to be sent to a custom visual. In this workout, the dataset passed into the Deneb custom visual is the 10x10 grid with a measure for the [Percent] to display, so the month, actuals, and budget data are by design not included. If the goal was to provide the month, actuals, and budget in the dataset (and thus such that they were “available” to be used as a filter based on the selection from a screen widget [i.e., month drop-down]) and do the percent calculation dynamically within the visual, then my first thoughts are that some re-work would be required to generate the 10x10 grid fully inside the Deneb visual. I have not needed to explore (nor seen) a Deneb visual in which both an in-visual dataset and the dataset provided by Power BI are used, so unfortunately I don’t have any pointers for you. I’ll think on it a bit and add to this thread if I come up with something.
Greg