Deneb Workout 02 - Bar Chart with Internal Labels

Difficulty Rating: 2 out of 5

One of the features of a Bar Chart created in Deneb in Power BI is that you can disable the Y-axis and instead show the labels overlapping the bars; this gives you a space-saving bar chart.

Goals
Using the simple supplied dataset, produce a Deneb visual in Power BI that:
• colours the bars using the first colour defined in the current Power BI theme
• rounds the end-corners of the bars
• instead of Y-axis labels, includes the labels overlapping the bars
• includes a title and subtitle

Submission
Load the supplied data file into a new Power BI file, create your solution, and reply to this post. Upload a screenshot of your solution along with the Deneb/Vega-Lite JSON code used. Please format your JSON code and blur it or place it in a hidden section.

Period
This workout will be released on Monday March 27, 2023, and the author’s solution will be posted on Sunday April 2, 2023.

Greg
Deneb Workout 02 - Data - Sales by Country.xlsx (8.8 KB)

Hi everyone,
This is my solution:
image

Json Code

{
“$schema”: “https://vega.github.io/schema/vega-lite/v5.json”,
“usermeta”: {
“deneb”: {
“build”: “1.4.0.0”,
“metaVersion”: 1,
“provider”: “vegaLite”,
“providerVersion”: “5.4.0”
},
“interactivity”: {
“tooltip”: true,
“contextMenu”: true,
“selection”: true,
“highlight”: true,
“dataPointLimit”: 50
},
“information”: {
“name”: “[No Name Provided]”,
“description”: “[No Description Provided]”,
“author”: “[No Author Details Provided]”,
“uuid”: “69318fdf-5909-4587-878b-654f4ab466c6”,
“generated”: “2023-03-27T23:28:23.874Z”
},
“dataset”: [
{
“key”: “0”,
“name”: “Country Name”,
“description”: “”,
“type”: “text”,
“kind”: “column”
},
{
“key”: “1”,
“name”: “Sum of Sales Amount”,
“description”: “”,
“type”: “numeric”,
“kind”: “measure”
}
]
},
“config”: {
“view”: {“stroke”: “transparent”},
“axis”: {
“ticks”: false,
“grid”: false,
“domain”: false
},
“axisX”: {“labelPadding”: 5},
“axisY”: {“labelPadding”: 10}
},
“title”: {
“text”: “Deneb Workout 02”,
“anchor”: “start”,
“font”: “Verdana”,
“fontWeight”: “bold”,
“fontSize”: 16,
“fontStyle”: “normal”,
“subtitle”: “Bar Chart with Internal Labels”,
“subtitleFont”: “Verdana”,
“subtitleFontWeight”: “normal”,
“subtitleFontSize”: 12,
“subtitleFontStyle”: “italic”,
“offset”: 15
},
“data”: {“name”: “dataset”},
“layer”: [
{
“name”: “BAR”,
“mark”: {
“type”: “bar”,
“height”: {“band”: 0.7},
“cornerRadiusEnd”: 30
},
“encoding”: {
“y”: {
“field”: “0”,
“type”: “nominal”,
“title”: null,
“baseline”: “middle”,
“axis”: {“labels”: false}
},
“x”: {
“field”: “1”,
“type”: “quantitative”,
“axis”: {
“title”: null,
“tickCount”: 3,
“grid”: true,
“gridColor”: “#C8C6C4”,
“gridDash”: [1, 5],
“labelFlush”: false
}
},
“color”: {
“field”: “City”,
“legend”: null,
“scale”: {
“scheme”: “pbiColorNominal”
}
}
}
},
{
“name”: “COUNTRY LABEL”,
“mark”: {
“type”: “text”,
“align”: “left”,
“color”: “black”,
“xOffset”: -240,
“font”: “Verdana”,
“fontSize”: 14,
“fontWeight”: “bold”
},
“encoding”: {
“text”: {“field”: “0”},
“y”: {
“field”: “0”,
“type”: “nominal”
}
}
}
]
}

{
“description”: “Bar Chart with Internal Labels”,
“title”: {
“text”: “Deneb Workout 02”,
“subtitle”: “Bar Chart with Internal Labels”,
“anchor”: “start”
},
“data”: {“name”: “dataset”},
“height”: {“step”: 75},
“layer”: [
{
“mark”: {
“type”: “bar”,
“color”: “#87cefa”,
“cornerRadiusEnd”: 50,
“height”: {“band”: 0.8}
},
“encoding”: {
“y”: {
“field”: “Country Name”,
“scale”: {“padding”: 0},
“axis”: {
“grid”: false,
“ticks”: false,
“labelAlign”: “left”,
“labelBaseline”: “middle”,
“labelPadding”: -5,
“title”: “”,
“titleX”: 5,
“titleY”: -5,
“titleAngle”: 0
}
},
“x”: {
“field”: “Sum of Sales Amount”,
“aggregate”: “sum”,
“axis”: {“grid”: false},
“title”: “Total Sales”
}
}
},
{
“mark”: {
“type”: “text”,
“align”: “left”,
“color”: “black”,
“xOffset”: -600,
“fontWeight”: “bold”,
“fontSize”: 16
},
“encoding”: {
“text”: {
“field”: “Country Name”
},
“y”: {
“field”: “Country Name”,
“type”: “nominal”
}
}
}
]
}

Hi @Greg ,

Thank you for this interesting workout. I began learning Vega-Lite by taking your course, and I was in need of some additional practice. This workout was timely and very engaging.

Here is my submission for this practice session. I am unsure how to use the first color of the Power BI theme.

image

{
  "data": {"name": "dataset"},
  "height": {"step": 40},
  "title": {
    "text": "Deneb WorkOut 02",
    "subtitle": "Bar Chart with Internal Labels",
    "fontSize": {
      "title": 20,
      "subtitle": 16
    },
    "fontWeight": "bold",
    "color": "black",
    "anchor": "start",
    "align": "left"
  },
  "encoding": {
    "y": {
      "field": "Country Name",
      "type": "nominal",
      "sort": {
        "field": "Sum of Sales Amount",
        "order": "descending"
      },
      "axis": null
    }
  },
  "layer": [
    {
      "mark": {
        "type": "bar",
        "opacity": 0.3,
        "tooltip": true,
        "cornerRadius": 30,
        "cornerRadiusTopLeft": 0,
        "cornerRadiusBottomLeft": 0,
        "color": "#8bc8f5"
      },
      "encoding": {
        "x": {
          "field": "Sum of Sales Amount",
          "type": "quantitative",
          "axis": {"title": null}
        }
      }
    },
    {
      "mark": {
        "type": "text",
        "align": "left",
        "x": 5,
        "fontSize": 17,
        "fontWeight": "bold",
        "color": "black"
      },
      "encoding": {
        "text": {
          "field": "Country Name"
        }
      }
    }
  ]
}

Regards,
Hafiz

1 Like

Hi @hafizsultan. You can refer to the Deneb documentation for accessing the theme colours.
Greg

1 Like

Thanks for sharing @Greg. It worked now.

Hi,

I have managed to achieve all the requirements

• colours the bars using the first colour defined in the current Power BI theme
• rounds the end-corners of the bars
• instead of Y-axis labels, includes the labels overlapping the bars
• includes a title and subtitle

image

{
  "title": {
    "text": "Deneb Workout 02",
    "anchor": "start",
    "align": "left",
    "subtitle": "Bar Chart with Internal Labels",
    "subtitleFontStyle": "italic"
  },
  "data": {"name": "dataset"},
  "encoding": {
    "y": {
      "field": "Country Name",
      "type": "nominal",
      "axis": null
    }
  },
  "layer": [
    {
      "mark": {
        "type": "bar",
        "height": 20,
        "cornerRadiusEnd": 15,
        "binSpacing": 0,
        "color": {
          "field": "Country Name",
          "expr": "pbiColor(0)"
        }
      },
      "encoding": {
        "x": {
          "field": "Sum of Sales Amount",
          "type": "quantitative"
        }
      }
    },
    {
      "mark": {
        "type": "text",
        "align": "left",
        "x": 10,
        "color": "white"
      },
      "encoding": {
        "text": {
          "field": "Country Name"
        }
      }
    }
  ]
}

Although I see the code is giving me the result as desired, I still have an error message, and i dont know how to interpret this long error message. So not sure what changes should i make to fix the error
@Greg , Can you please share some advise on this error.

The error is due to this part of the code :

image

And the error i am getting is : `
should NOT have additional property: layer

should have required property ‘mark’

should NOT have additional property: encoding

should NOT have additional property: layer

should have required property ‘facet’

should have required property ‘spec’
Ln 18 .layer[0]
should NOT have additional property: mark
Ln 18 .layer[0]
should have required property ‘layer’
Ln 19 .layer[0].mark
should be string
Ln 19 .layer[0].mark
should be equal to constant
Ln 19 .layer[0].mark
should be string
Ln 19 .layer[0].mark
should be equal to constant
Ln 19 .layer[0].mark
should be string
Ln 19 .layer[0].mark
should be equal to constant
Ln 19 .layer[0].mark
should match some schema in anyOf
Ln 19 .layer[0].mark
should NOT have additional property: height
Ln 19 .layer[0].mark
should NOT have additional property: cornerRadiusEnd
Ln 19 .layer[0].mark
should NOT have additional property: binSpacing
Ln 24 .layer[0].mark.color
should be string
Ln 24 .layer[0].mark.color
should be equal to one of: “black”, “silver”, “gray”, “white”, “maroon”, (143 more…)
Ln 24 .layer[0].mark.color
should be string
Ln 24 .layer[0].mark.color
should be string
Ln 24 .layer[0].mark.color
should match some schema in anyOf
Ln 24 .layer[0].mark.color
should NOT have additional property: field
Ln 24 .layer[0].mark.color
should NOT have additional property: expr
Ln 24 .layer[0].mark.color
should have required property ‘gradient’
Ln 24 .layer[0].mark.color
should have required property ‘stops’
Ln 24 .layer[0].mark.color
should NOT have additional property: field
Ln 24 .layer[0].mark.color
should NOT have additional property: expr
Ln 24 .layer[0].mark.color
should have required property ‘gradient’
Ln 24 .layer[0].mark.color
should have required property ‘stops’
Ln 24 .layer[0].mark.color
should match some schema in anyOf
Ln 24 .layer[0].mark.color
should NOT have additional property: field
Ln 24 .layer[0].mark.color
should match some schema in anyOf
Ln 20 .layer[0].mark.type
should be equal to constant
Ln 19 .layer[0].mark
should match some schema in anyOf
Ln 19 .layer[0].mark
should be string
Ln 19 .layer[0].mark
should be equal to one of: “arc”, “area”, “bar”, “image”, “line”, (9 more…)
Ln 24 .layer[0].mark.color
should be string
Ln 24 .layer[0].mark.color
should be equal to one of: “black”, “silver”, “gray”, “white”, “maroon”, (143 more…)
Ln 24 .layer[0].mark.color
should be string
Ln 24 .layer[0].mark.color
should be string
Ln 24 .layer[0].mark.color
should match some schema in anyOf
Ln 24 .layer[0].mark.color
should NOT have additional property: field
Ln 24 .layer[0].mark.color
should NOT have additional property: expr
Ln 24 .layer[0].mark.color
should have required property ‘gradient’
Ln 24 .layer[0].mark.color
should have required property ‘stops’
Ln 24 .layer[0].mark.color
should NOT have additional property: field
Ln 24 .layer[0].mark.color
should NOT have additional property: expr
Ln 24 .layer[0].mark.color
should have required property ‘gradient’
Ln 24 .layer[0].mark.color
should have required property ‘stops’
Ln 24 .layer[0].mark.color
should match some schema in anyOf
Ln 24 .layer[0].mark.color
should NOT have additional property: field
Ln 24 .layer[0].mark.color
should match some schema in anyOf
Ln 19 .layer[0].mark
should match some schema in anyOf
Ln 18 .layer[0]
should match some schema in anyOf

should NOT have additional property: encoding

should NOT have additional property: layer

should have required property ‘repeat’

should have required property ‘spec’

should NOT have additional property: encoding

should NOT have additional property: layer

should have required property ‘repeat’

should have required property ‘spec’

should match some schema in anyOf

should NOT have additional property: encoding

should NOT have additional property: layer

should have required property ‘concat’

should NOT have additional property: encoding

should NOT have additional property: layer

should have required property ‘vconcat’

should NOT have additional property: encoding

should NOT have additional property: layer

should have required property ‘hconcat’

should match some schema in anyOf`

Thanks

Hi @jsodhi.

Yeah, the Vega-Lite error messages can be both extensive and uninformative; I tend to ignore them as long as the code formats properly.

That said, when I remove the unnecessary line

"field": "Country Name",

from the bar mark color block, the errors go away.

Summary

Hope this helps.
Greg

1 Like

Thanks @Greg
Yes. That information helps.
Apprecieate your quick response.

I need to practice Deneb and this is a good way. I struggled with the implementation of the layer syntax, but finally got the hang of it. Greg, thank you very much for your tutorial on creating the bar chart. It was very helpful, otherwise I would have been lost. Here’s my submission:
Deneb_workout_002_submission

Deneb code
{
  "title": {
    "text": "Deneb Workout 002",
    "subtitle": "Bar Chart with Internal Labels",
    "anchor": "start",
    "align": "left"
  },
  "data": {"name": "dataset"},
  "layer": [
    {
      "mark": {
        "type": "bar",
        "color": {
          "expr": "pbiColor(0,0.5)"
        },
        "cornerRadiusEnd": 50,
        "height": 40
      },
      "encoding": {
        "y": {
          "field": "Country",
          "type": "nominal",
          "title": null,
          "axis": null
        },
        "x": {
          "field": "Sales Amount",
          "type": "quantitative",
          "title": null
        }
      }
    },
    {
      "mark": {
        "type": "text",
        "align": "left",
        "xOffset": -210,
        "color": "black",
        "fontSize": 14,
        "fontWeight": "bold"
      },
      "encoding": {
        "text": {"field": "Country"},
        "y": {"field": "Country"}
      }
    }
  ]
}

Hi,
this is my solution.

Screenshot 2023-03-30 152738

{
  "data": {"name": "dataset"},
  "title": {
    "text": "Deneb Workout 02",
    "subtitle": "Bar Chart with Internal Labels",
    "anchor": "start",
    "align": "left"
  },
  "layer": [
    {
      "mark": {
        "type": "bar",
        "tooltip": true,
        "color": {
          "expr": "pbiColor(0)"
        },
        "cornerRadiusBottomRight": 35,
        "cornerRadiusTopRight": 35
      },
      "encoding": {
        "x": {
          "field": "Sum of Sales Amount"
        }
      }
    },
    {
      "mark": {
        "type": "text",
        "align": "left",
        "x": 5,
        "fontSize": 16,
        "fontWeight": "bold",
        "color": "#ffffff"
      },
      "encoding": {
        "text": {
          "field": "Country Name"
        }
      }
    }
  ],
  "encoding": {
    "y": {
      "field": "Country Name",
      "type": "nominal",
      "axis": null
    },
    "x": {
      "type": "quantitative",
      "axis": {"title": ""}
    }
  }
}

Thank you @Greg for the workouts :wink:

In the above, why is it not sorted descending by “Sum of Sales” on Y-axis. Based on the code “encoding”: {
“y”: {
“field”: “Country Name”,
“type”: “nominal”,
“sort”: {
“field”: “Sum of Sales Amount”,
“order”: “descending”
},
“axis”: null
}
},
I was expecting it to sort by Sum of Sales.
Also what to include to show Sales amount on the right inside the bar chart?
Thanks,
Salil

Hi @Salil. The code used is missing the “op” operation; refer to the sorting section of the Deneb Cheat Sheet for more details.

Greg

Hi @Salil ,

As mentioned by @Greg , I have managed to sort it using “op” operation. Also, I have added the labels but position of the labels is static. I would like them to be at the end of the bar but I am not sure how to achieve this. Below is the code and the graph.

image

{
“data”: {“name”: “dataset”},
“height”: {“step”: 40},
“title”: {
“text”: “Deneb WorkOut 02”,
“subtitle”: “Bar Chart with Internal Labels”,
“fontSize”: {
“title”: 20,
“subtitle”: 16
},
“fontWeight”: “bold”,
“color”: “black”,
“anchor”: “start”,
“align”: “left”
},
“transform”: [
{
“calculate”: “toNumber(datum[‘Sum of Sales Amount’])”,
“as”: “Sales Amount”
}
],
“encoding”: {
“y”: {
“field”: “Country Name”,
“type”: “nominal”,
“sort”: {
“op”: “sum”,
“field”: “Sum of Sales Amount”,
“order”: “descending”
},
“axis”: null
}
},
“layer”: [
{
“mark”: {
“type”: “bar”,
“opacity”: 0.3,
“tooltip”: true,
“cornerRadius”: 30,
“cornerRadiusTopLeft”: 0,
“cornerRadiusBottomLeft”: 0,
“color”: {“expr”: “pbiColor(0)”}
},
“encoding”: {
“x”: {
“field”: “Sum of Sales Amount”,
“type”: “quantitative”,
“axis”: {“title”: null}
}
}
},
{
“mark”: {
“type”: “text”,
“align”: “left”,
“x”: 5,
“fontWeight”: “bold”,
“fontSize”: 17,
“color”: “black”
},
“encoding”: {
“text”: {
“field”: “Country Name”
}
}
},
{
“mark”: {
“type”: “text”,
“align”: “left”,
“x”: 200
},
“encoding”: {
“text”: {
“field”: “Sum of Sales Amount”,
“type”: “quantitative”,
“format”: “.2s”
}
}
}
]
}

Hi @hafizsultan. You need to add Y encoding; you can repeat that from the bar mark, or, ideally, move the Y encoding block outside the layer.
Greg

Hi everyone,

I liked this workout, I learned new things. This is my solution:

Please find my Deneb/Vega-Lite JSON code:

{
  "title": {
    "text": "Deneb Workout 02",
    "subtitle": "Bar Chart with Internal Labels",
    "subtitleFontStyle": "italic",
    "anchor": "start",
    "align": "left",
    "font": "Verdana",
    "fontSize": 16,
    "fontWeight": "bold",
    "offset": 10
  },
  "data": {"name": "dataset"},
  "layer": [
    {
      "mark": {
        "description": "Bar for each country",
        "type": "bar",
        "size": {
          "expr": "bandwidth('y') * 0.7"},
        "cornerRadiusEnd": 35,
        "color": {"expr": "pbiColor(0)"}
      },
      "encoding": {
        "x": {
          "field": "Total Sales_",
          "type": "quantitative",
          "axis": {
            "tickCount": 3,
            "title": null,
            "ticks": false,
            "grid": true,
            "gridColor": "#C8C6C4",
            "gridDash": [1, 5],
            "domain": false,
            "labelFlush": false
          }
        }
      }
    },
    {
      "mark": {
        "description": "Country Label",
        "type": "text",
        "align": "left",
        "dx": 5,
        "color": "black",
        "fontWeight": "bold",
        "fontSize": 24
      },
      "encoding": {
        "x": {"datum": 0},
        "text": {
          "field": "Country Name"
        }
      }
    }
  ],
  "encoding": {
    "y": {
      "field": "Country Name",
      "type": "nominal",
      "axis": null
    },
    "x": {
      "field": "Total Sales_",
      "type": "quantitative"
    }
  }
}

Looking forward for next work out.

Hi @Greg ,

Thank you for the guidance. I had already “Y” encoding outside of layer block but I did not had “x” encoding inside the 2nd lable of [Sale amount]. So, if I have added the “x” encoding in the “text” barmark of [Sale amount], it did the trick. Good learning for me. @Salil FYI the snapshot and code is given below:

image

{
“data”: {“name”: “dataset”},
“height”: {“step”: 40},
“title”: {
“text”: “Deneb WorkOut 02”,
“subtitle”: “Bar Chart with Internal Labels”,
“fontSize”: {
“title”: 20,
“subtitle”: 16
},
“fontWeight”: “bold”,
“color”: “black”,
“anchor”: “start”,
“align”: “left”
},
“transform”: [
{
“calculate”: “toNumber(datum[‘Sum of Sales Amount’])”,
“as”: “Sales Amount”
}
],
“encoding”: {
“y”: {
“field”: “Country Name”,
“type”: “nominal”,
“sort”: {
“op”: “sum”,
“field”: “Sum of Sales Amount”,
“order”: “descending”
},
“axis”: null
}
},
“layer”: [
{
“mark”: {
“type”: “bar”,
“opacity”: 0.3,
“tooltip”: true,
“cornerRadius”: 30,
“cornerRadiusTopLeft”: 0,
“cornerRadiusBottomLeft”: 0,
“color”: {“expr”: “pbiColor(0)”}
},“encoding”:
{
“x”: {
“field”: “Sum of Sales Amount”,
“type”: “quantitative”,
“axis”: {“title”: null}
}
}
},
{
“mark”: {
“type”: “text”,
“align”: “left”,
“x”: 0,
“fontWeight”: “bold”,
“fontSize”: 17,
“color”: “black”
},
“encoding”: {
“text”: {
“field”: “Country Name”
}
}
},
{
“mark”: {
“type”: “text”,
“align”: “left”,
“x2”: {“field”: “Sum of Sales Amount”, “type”: “quantitative”},
“fontSize”: 17,
“fontWeight”: “bold”,
“color”: “black”,
“dx”:10
},
“encoding”: {
“text”: {
“field”: “Sum of Sales Amount”,
“type”: “quantitative”,
“format”: “.2s”
}, “x”: {
“field”: “Sum of Sales Amount”,
“type”: “quantitative”,
“axis”: {“title”: null}
}
}
}
]
}

1 Like

Hi Greg,
Thanks for the Deneb workout. I struggled with the brackets and comma’s but was slowly getting better.

Here is my solution:

Summary

{
“title”: {
“text”: “Deneb Workout 02”,
“fontSize”: 16,
“anchor”: “start”,
“align”: “left”,
“subtitle”: “Bar Chart with Internal Labels”,
“subtitleFontStyle”: “italic”

},
“data”: {“name”: “dataset”},
“encoding”: {
“y”: {
“field”: “Country Name”,
“type”: “nominal”,
“axis”: null
}
},
“description”: “COUNTRY BAR”,
“layer”: [
{
“mark”: {
“type”: “bar”,
“height”: 50,
“cornerRadiusEnd”: 20,
“color”: “red”
},
“encoding”: {
“x”: {
“field”: “Total Sales”,
“type”: “quantitative”,
“title”: null,
“axis”: {
“tickCount”: 2,
“format”: “#0,.M”,
“formatType”: “pbiFormat”
}
}
}
},
{
“description”: “COUNTRY LABEL”,
“mark”: {
“type”: “text”,
“align”: “left”,
“x”: 10,
“color”: “#FFFFFF”,
“fontSize”: 12,
“fontWeight”: “bold”
},
“encoding”: {
“text”: {
“field”: “Country Name”
}
}
}
]
}

Thank you for the layer workout.

2023-04-01 12_03_38-Workout1 - Power BI Desktop

Code

{
“title”: {
“anchor”: “start”,
“text”: “Deneb Workout 02”,
“subtitle”: “Bar Chart with Internal Labels”,
“subtitleFontStyle”: “italic”
},
“data”: {“name”: “dataset”},
“layer”:
[
{
“mark”: {
“type”: “bar”,
“cornerRadiusEnd”: 20,
“size”: 20,
“color”: {“expr”: “pbiColor(0)”}
},
“encoding”: {
“x”: {
“field”: “W2 Sales Amount”,
“type”: “quantitative”,
“title”: “Sales”
},
“y”: {
“field”: “Country Name”,
“type”: “nominal”,
“axis”: null
}
}
},
{
“mark”: {
“type”: “text”,
“align”: “left”,
“x”: 10,
“color”: “black”,
“fontSize”: 12,
“fontWeight”: “bold”
},
“encoding”: {
“text”: {“field”: “Country Name”},
“y”: {“field”: “Country Name”}
}
}
]
}

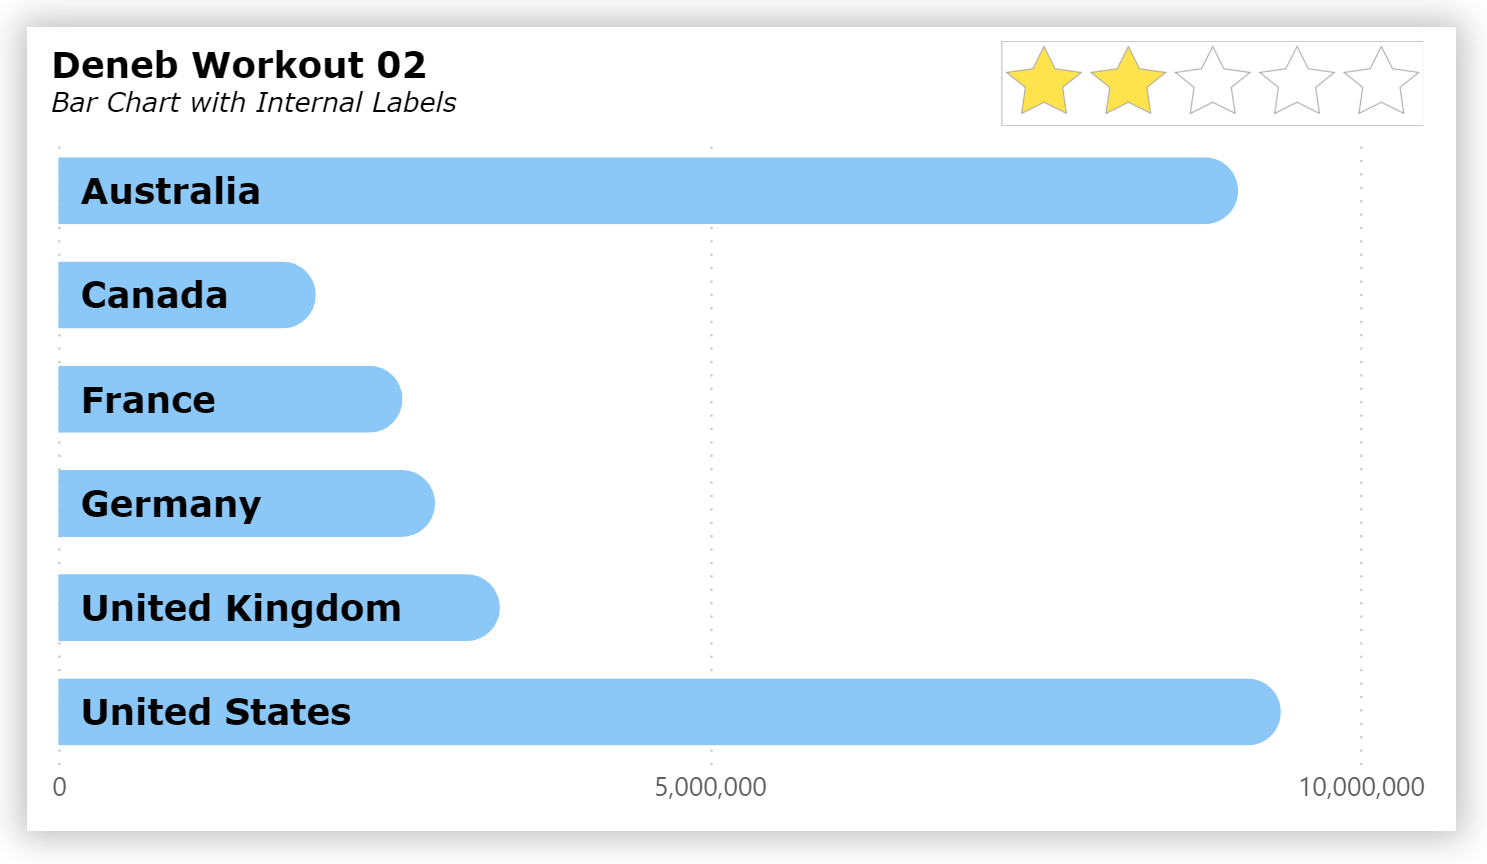
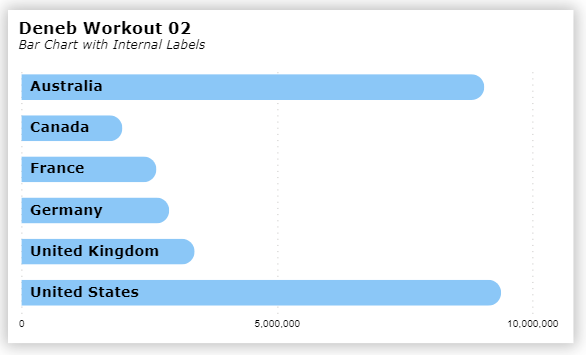
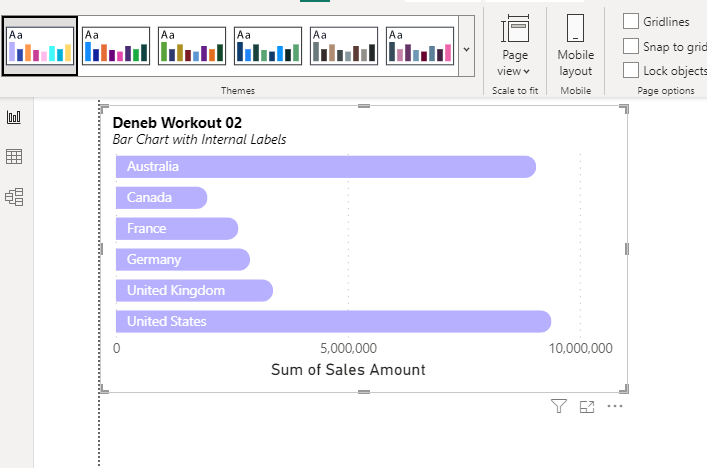
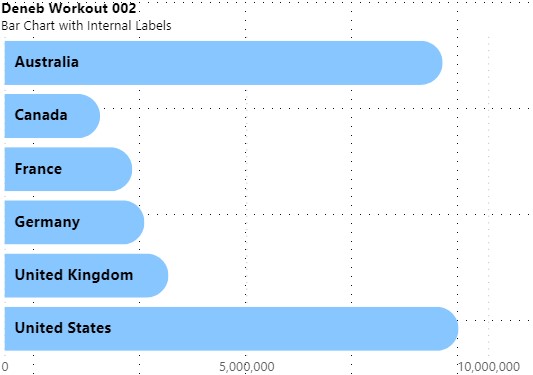
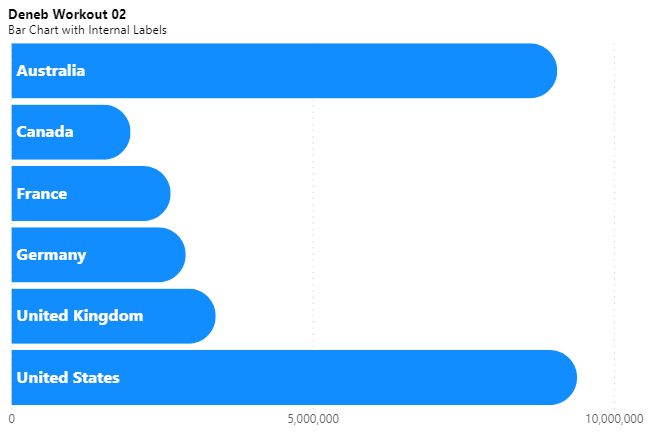
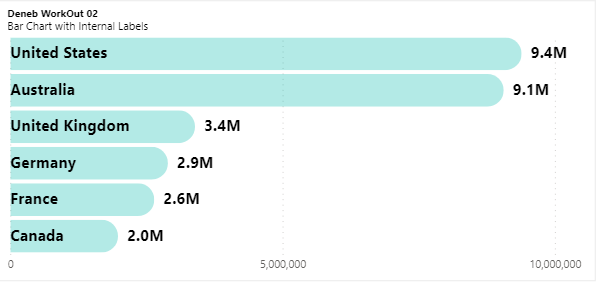
Here’s my solution to this workout:
Deneb Workout 02 - Bar Chart with Internal Labels - Solution Screenshot #1

In it, I used several Deneb/Vega-Lite features, including:
• used a title block complete with subtitle
• used shared encoding for the y-axis for both marks in the layer block by moving the y-axis encoding block outside the layer
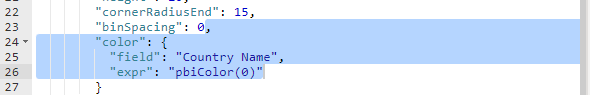
• set the colour of the bar mark to use the first colour of the current Power BI theme (via the “color”: { “expr”: “pbiColor(0)” } key:value pair)
• set the x position of the country label to zero (via the “x”: {“datum”: 0} key:value pair in the encoding block), then moved the label 10 pixels to the right (via the “xOffset”: 10 key:value pair)
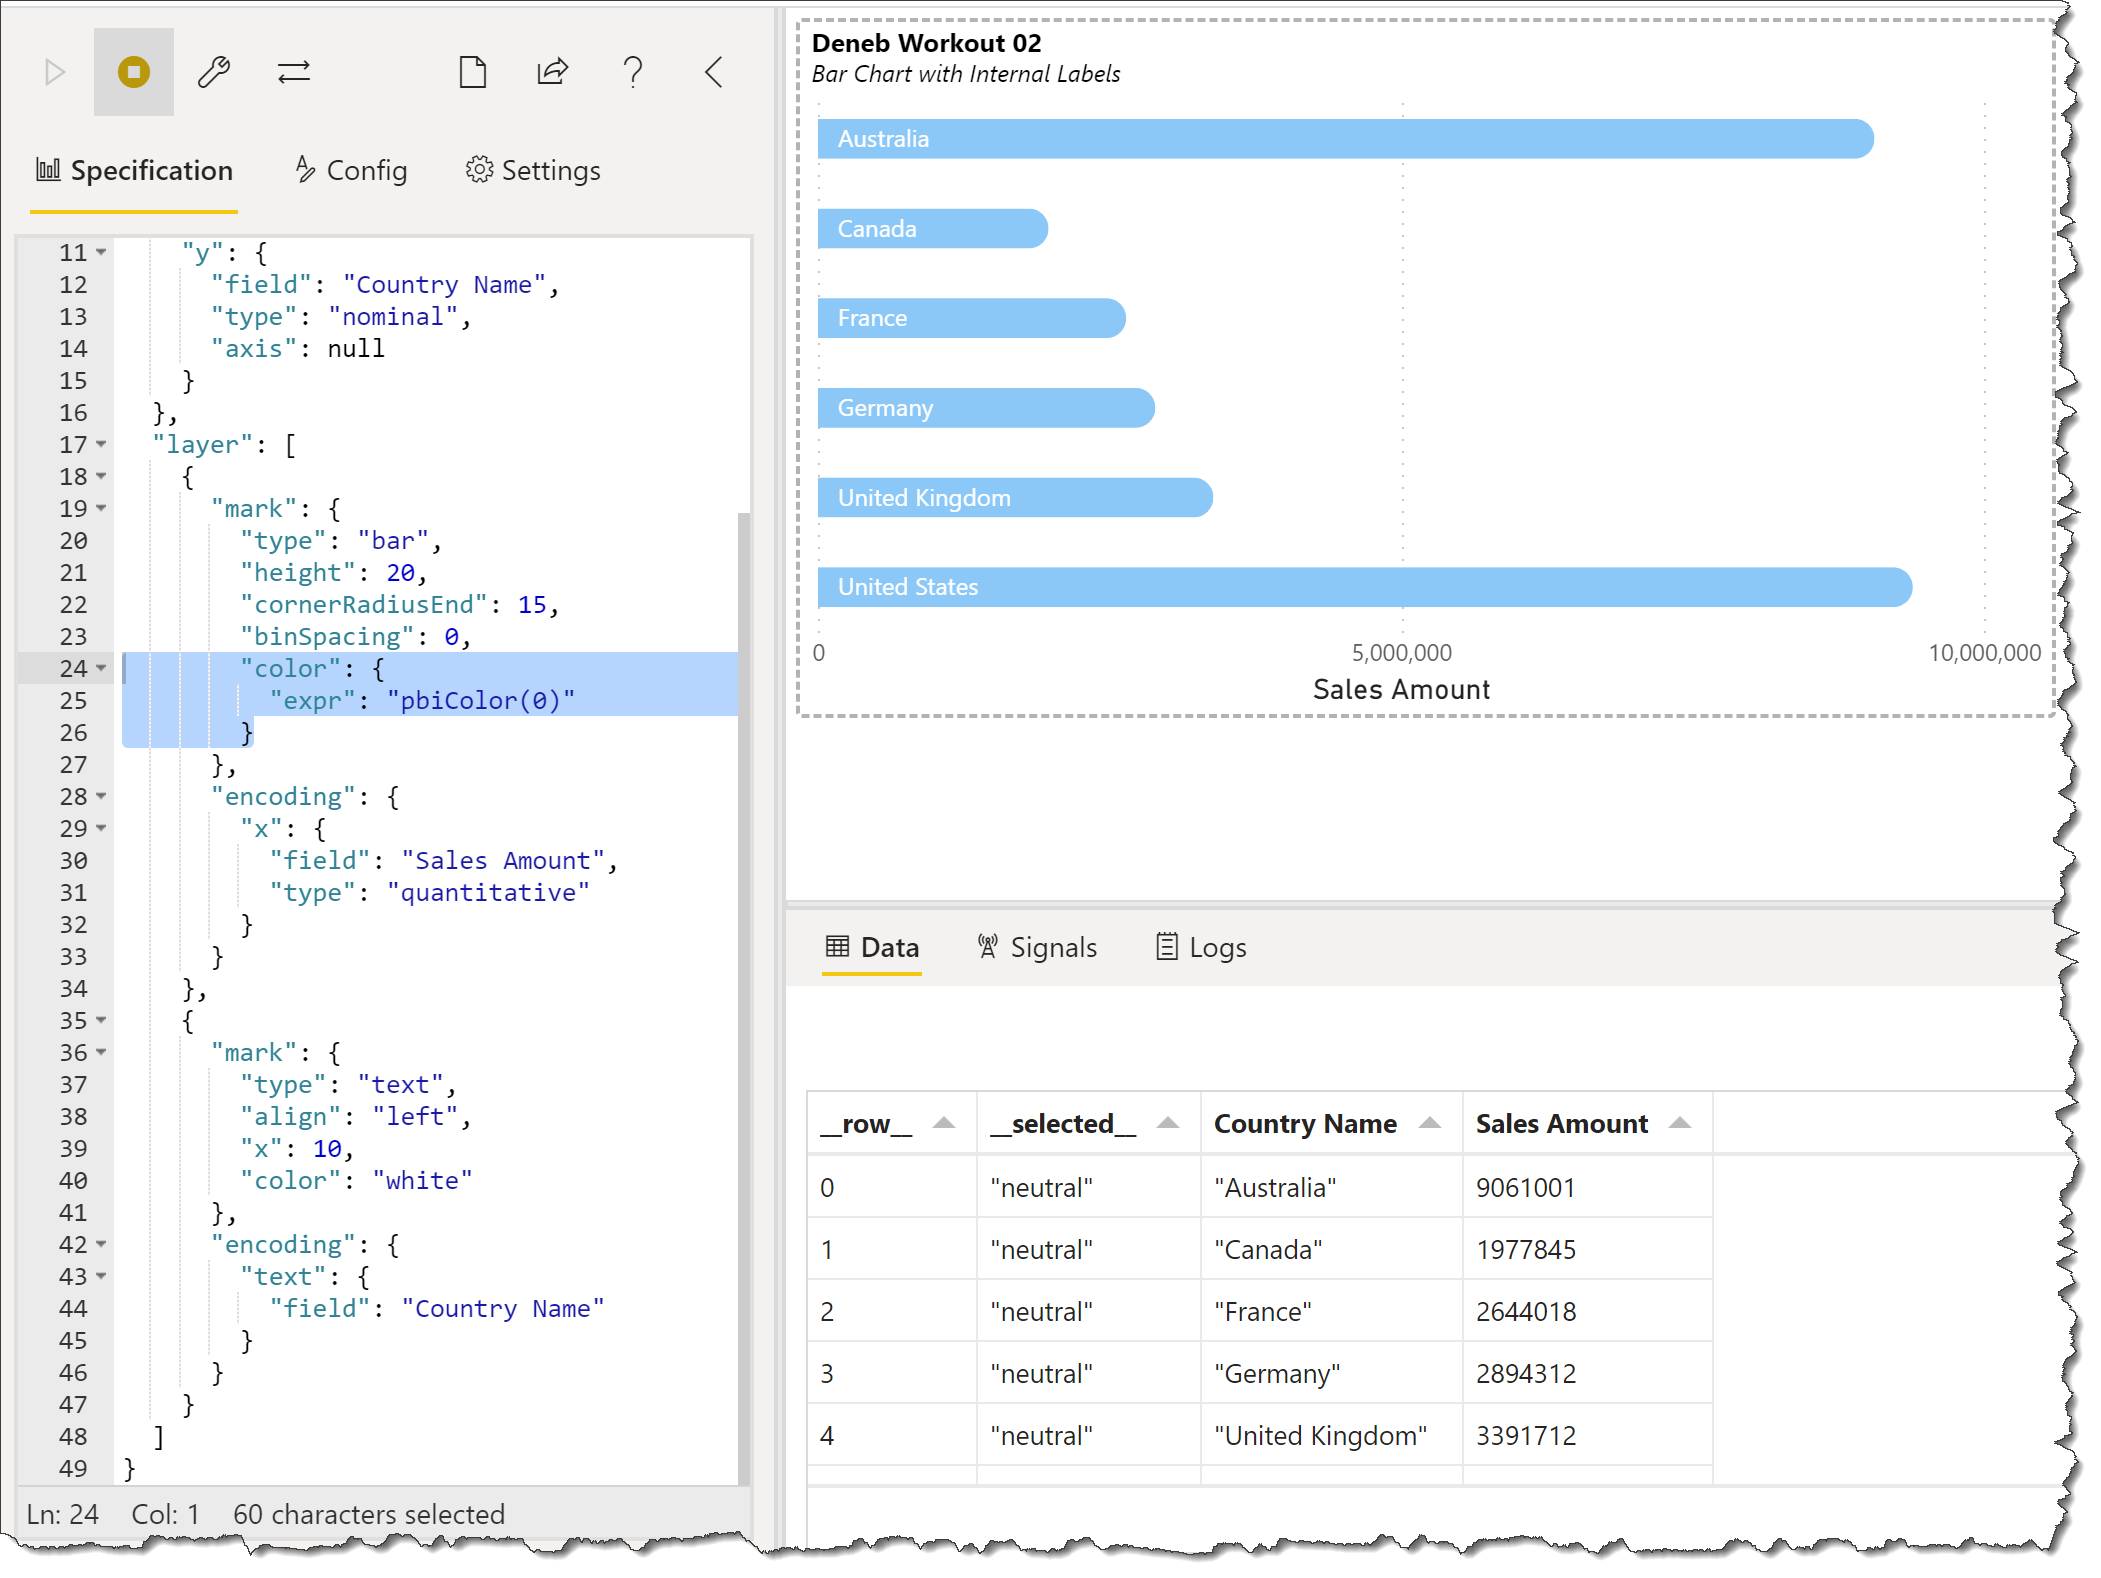
Here’s the code:

{
  "title": {
    "anchor": "start",
    "align": "left",
    "offset": 10,
    "text": "Deneb Workout 02",
    "font": "Verdana",
    "fontSize": 16,
    "fontWeight": "bold",
    "fontStyle": "normal",
    "subtitle": "Bar Chart with Internal Labels",
    "subtitleFont": "Verdana",
    "subtitleFontSize": 12,
    "subtitleFontWeight": "normal",
    "subtitleFontStyle": "italic"
  },
  "data": {"name": "dataset"},
  "encoding": {
    "y": {
      "field": "Country Name",
      "type": "nominal",
      "axis": null
    }
  },
  "layer": [
    {
      "name": "COUNTRY_SALES",
      "mark": {
        "type": "bar",
        "tooltip": true,
        "color": {
          "expr": "pbiColor(0)"
        },
        "height": 30,
        "cornerRadiusEnd": 15
      },
      "encoding": {
        "x": {
          "field": "Sales Amount",
          "type": "quantitative",
          "axis": {"title": null}
        }
      }
    },
    {
      "name": "COUNTRY_LABEL",
      "mark": {
        "type": "text",
        "align": "left",
        "xOffset": 10,
        "yOffset": 1,
        "color": "black",
        "font": "Verdana",
        "fontSize": 16,
        "fontWeight": "bold"
      },
      "encoding": {
        "x": {"datum": 0},
        "text": {
          "field": "Country Name",
          "type": "nominal"
        }
      }
    }
  ]
}

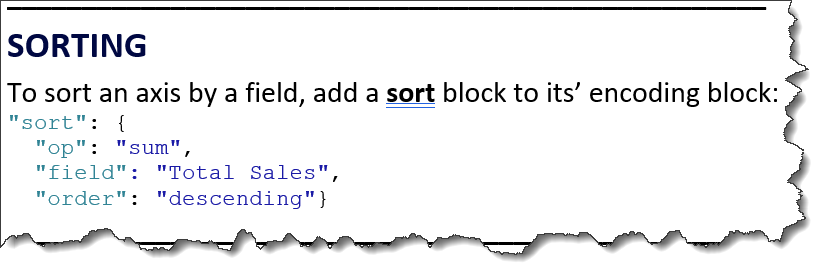
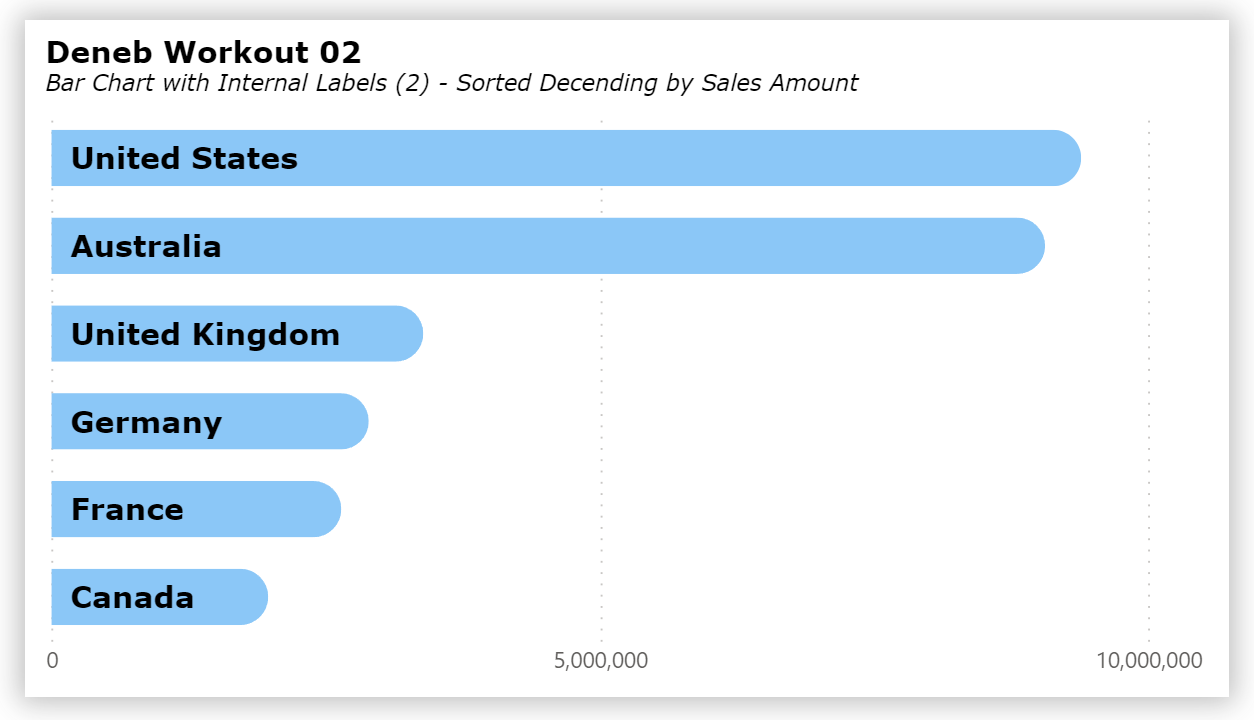
While the default sorting of an axis encoding channel is alphabetical/numeric, you can force sorting by adding a sort block to the axis desired. Here’s an alternate solution displaying the Y axis sorted using the “sum” operation in “descending” order by the “Sales Amount” field:

Here’s the code:

{
  "title": {
    "anchor": "start",
    "align": "left",
    "offset": 10,
    "text": "Deneb Workout 02",
    "font": "Verdana",
    "fontSize": 16,
    "fontWeight": "bold",
    "fontStyle": "normal",
    "subtitle": "Bar Chart with Internal Labels (2) - Sorted Decending by Sales Amount",
    "subtitleFont": "Verdana",
    "subtitleFontSize": 12,
    "subtitleFontWeight": "normal",
    "subtitleFontStyle": "italic"
  },
  "data": {"name": "dataset"},
  "encoding": {
    "y": {
      "field": "Country Name",
      "type": "nominal",
      "axis": null,
      "sort": {
        "op": "sum",
        "field": "Sales Amount",
        "order": "descending"
      }
    }
  },
  "layer": [
    {
      "name": "COUNTRY_SALES",
      "mark": {
        "type": "bar",
        "tooltip": true,
        "color": {
          "expr": "pbiColor(0)"
        },
        "height": 30,
        "cornerRadiusEnd": 15
      },
      "encoding": {
        "x": {
          "field": "Sales Amount",
          "type": "quantitative",
          "axis": {"title": null}
        }
      }
    },
    {
      "name": "COUNTRY_LABEL",
      "mark": {
        "type": "text",
        "align": "left",
        "xOffset": 10,
        "yOffset": 1,
        "color": "black",
        "font": "Verdana",
        "fontSize": 16,
        "fontWeight": "bold"
      },
      "encoding": {
        "x": {"datum": 0},
        "text": {
          "field": "Country Name",
          "type": "nominal"
        }
      }
    }
  ]
}

Congratulations to all who participated, and good luck.
Greg
Deneb Workout 02 - Bar Chart with Internal Labels.pbix (1.4 MB)

3 Likes