DENEB - View Repeat with 2 layers

Hello everybody,

I created the visualization below, using 2 measures (Sales and Target)

image

the created code was made as below

But I would like to have the data labels instead of having the y-axis

How should I proceed to be able to insert the data labels?

I know you have to use the MARK TEXT , but I don’t know how to proceed in this case

I thank you for your help

Hi @domingo42

There are often multiple ways of doing something in Deneb/Vega-Lite. Using you code as a start:

To turn off the Y-axis, add an axis/null line into the y encoding block
“axis”: null

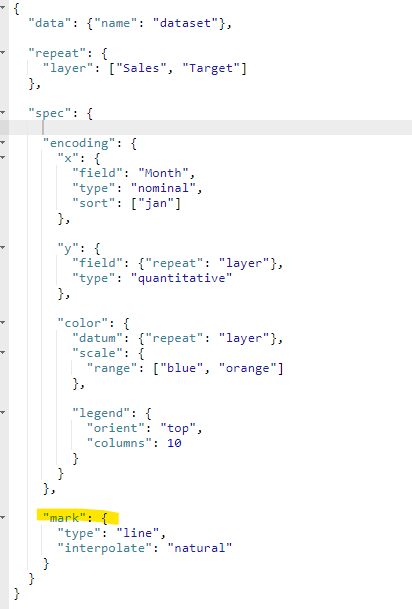
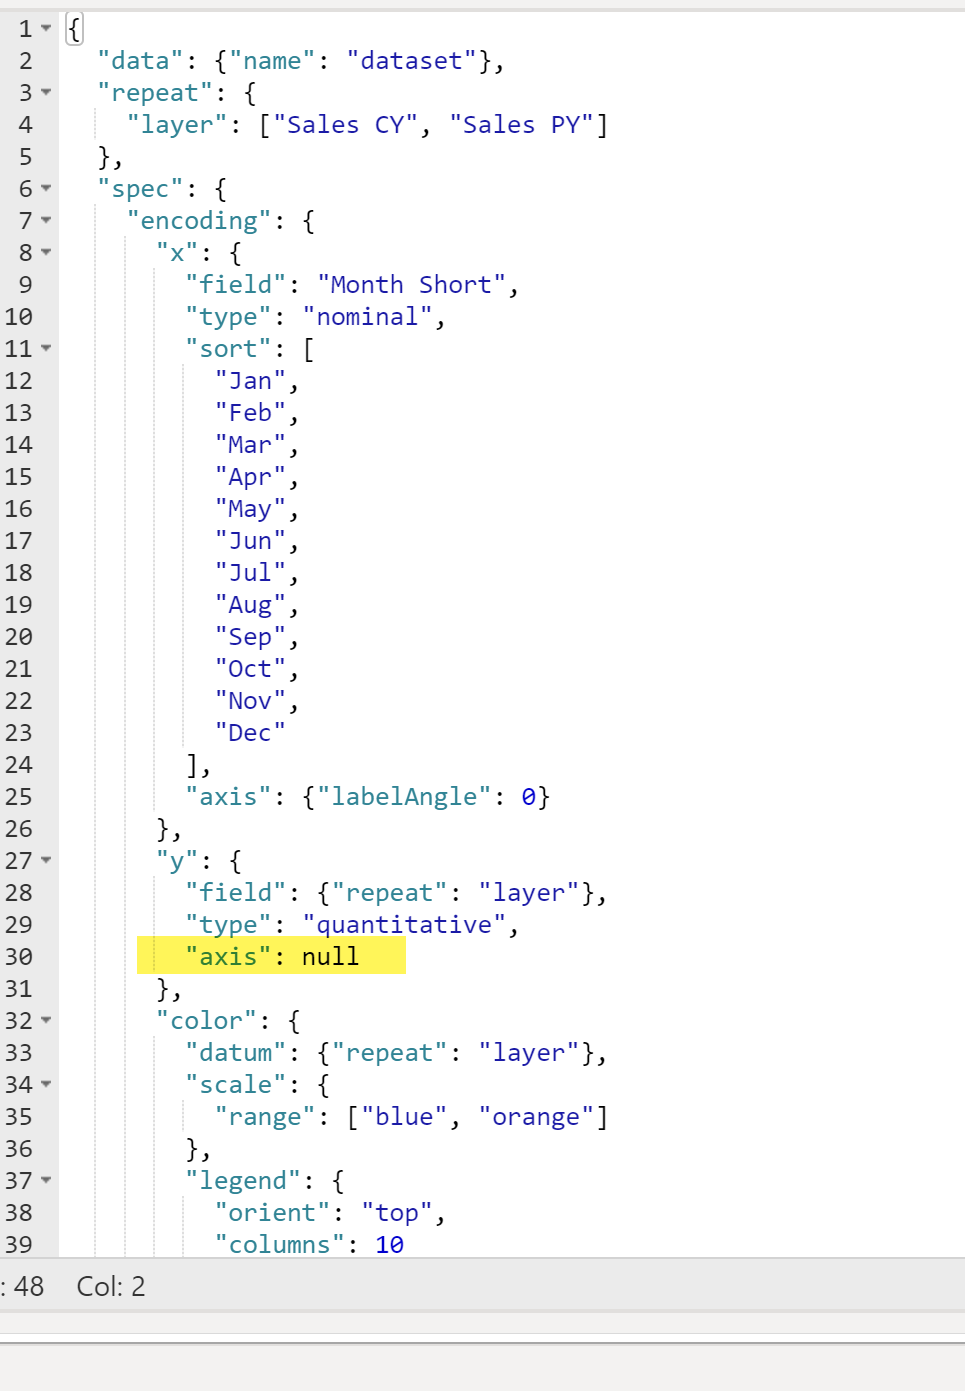
As for data labels, you’ll need to add another mark to the spec (this time of type = text). The way forward with you code sample didn’t fall out easily; I’d probably start with a standard line mark for [Sales], add a standard line mark for [Target], then add the text marks before looking into the repeat block (I’ve very little experience with the repeat syntax.). I’d review the examples on the Vega-Lite website for more info.

Hope this helps.
Greg

Hello @domingo42

Did the response from @Greg (thank you!) help solve your query?

If not, can you let us know where you’re stuck and what additional assistance you need?

If it did, please mark the answer as the SOLUTION by clicking the three dots beside Reply and then tick the check box beside SOLUTION

Thank you

1 Like

Thanks Greg,

I also don’t have much knowledge of the Repeat Mark.

I did it using 2 line marks and adding the texts as you mentioned.

Thanks.

Hi @domingo42. I watched some Vega-Lite tutorials over the weekend and gained more insight into the repeat mark and was able to come up with this:

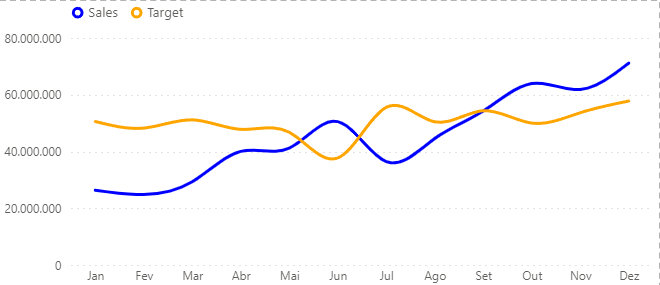
So, while I was able to get the data labels showing, they can overlap and reading them can be challenging; not sure if this is what you were going for, and even though this thread is solved, I decided to post anyway for documentation and in case it is of interest.
Greg
eDNA Forum - Deneb Y-axis off datalabels on.pbix (1.7 MB)
https://vis-au.github.io/vl/