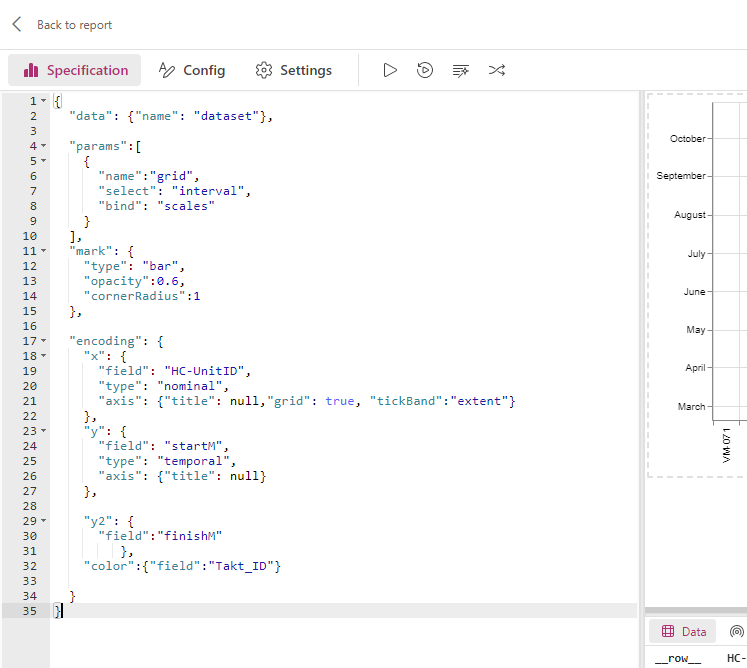
I don’t on the surface see anything wrong with your Deneb/Vega-Lite code, but do see a data issue:
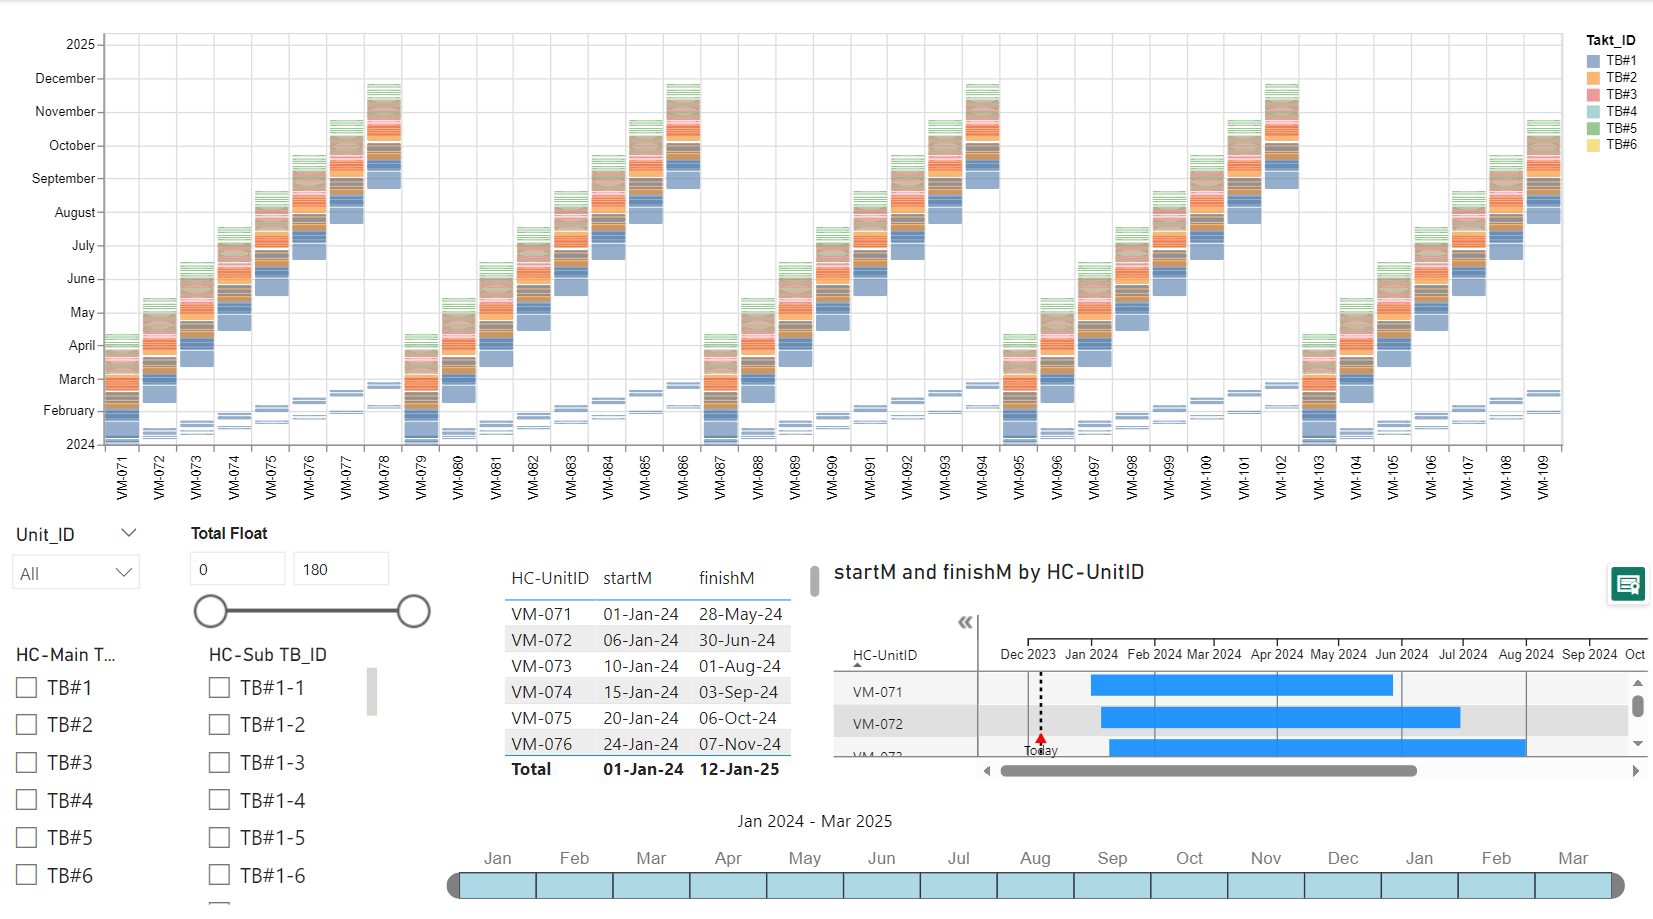
- when a task/subtask is selected (e.g., TB #3/TB#3-2) that has a positive difference in days between the start and finish dates, the bars display correctly
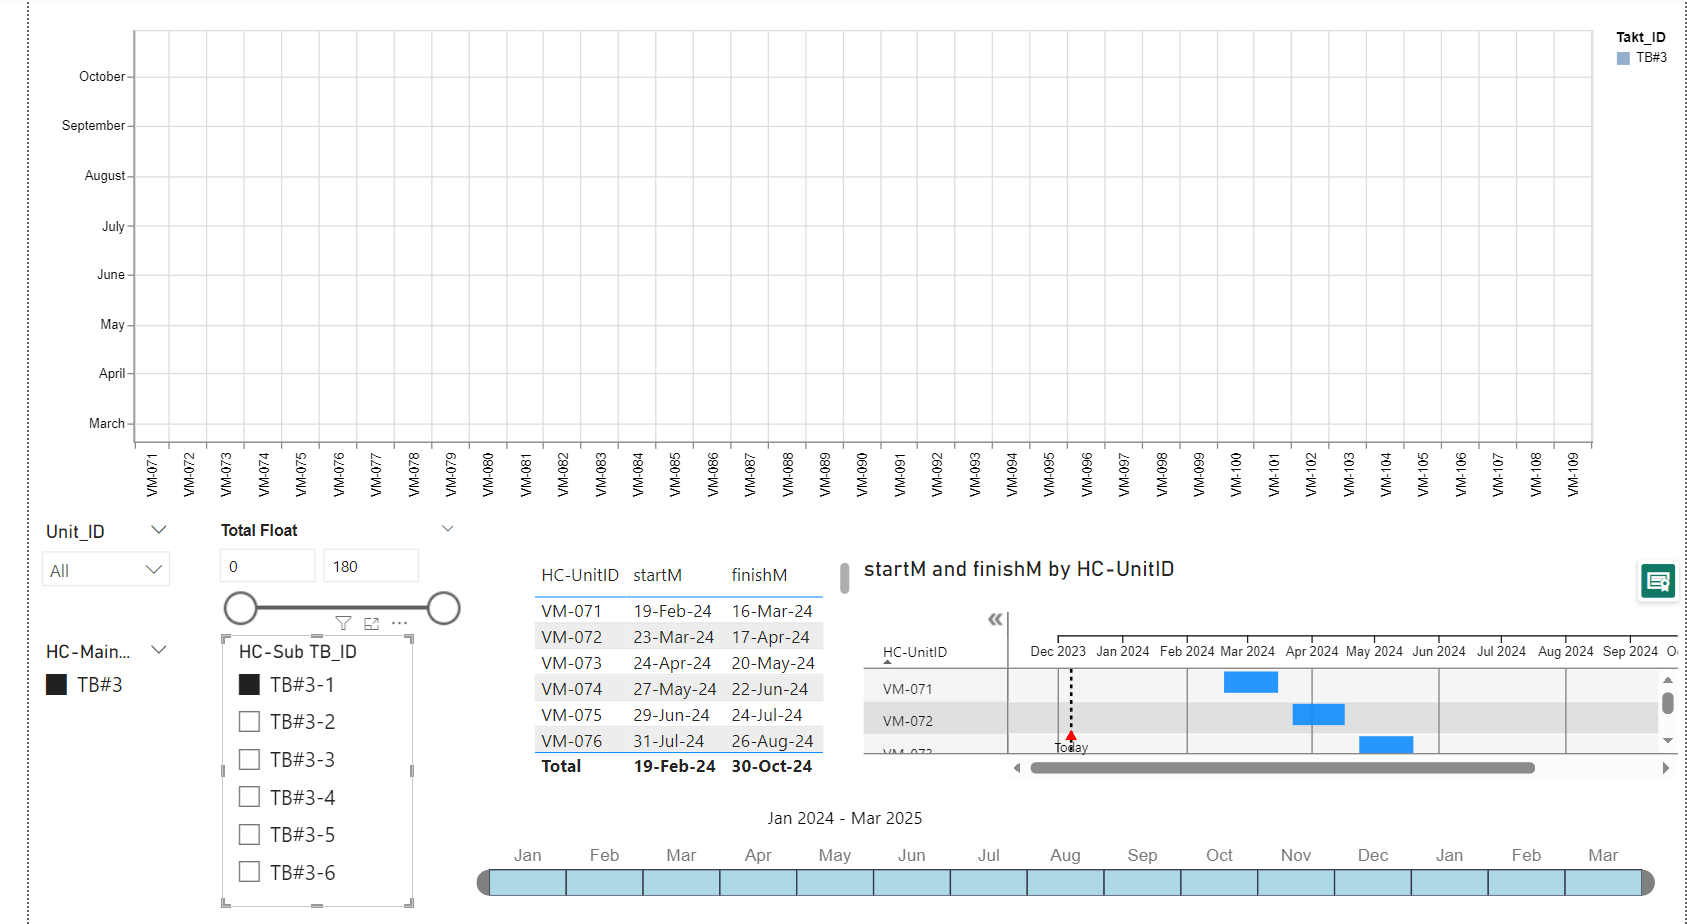
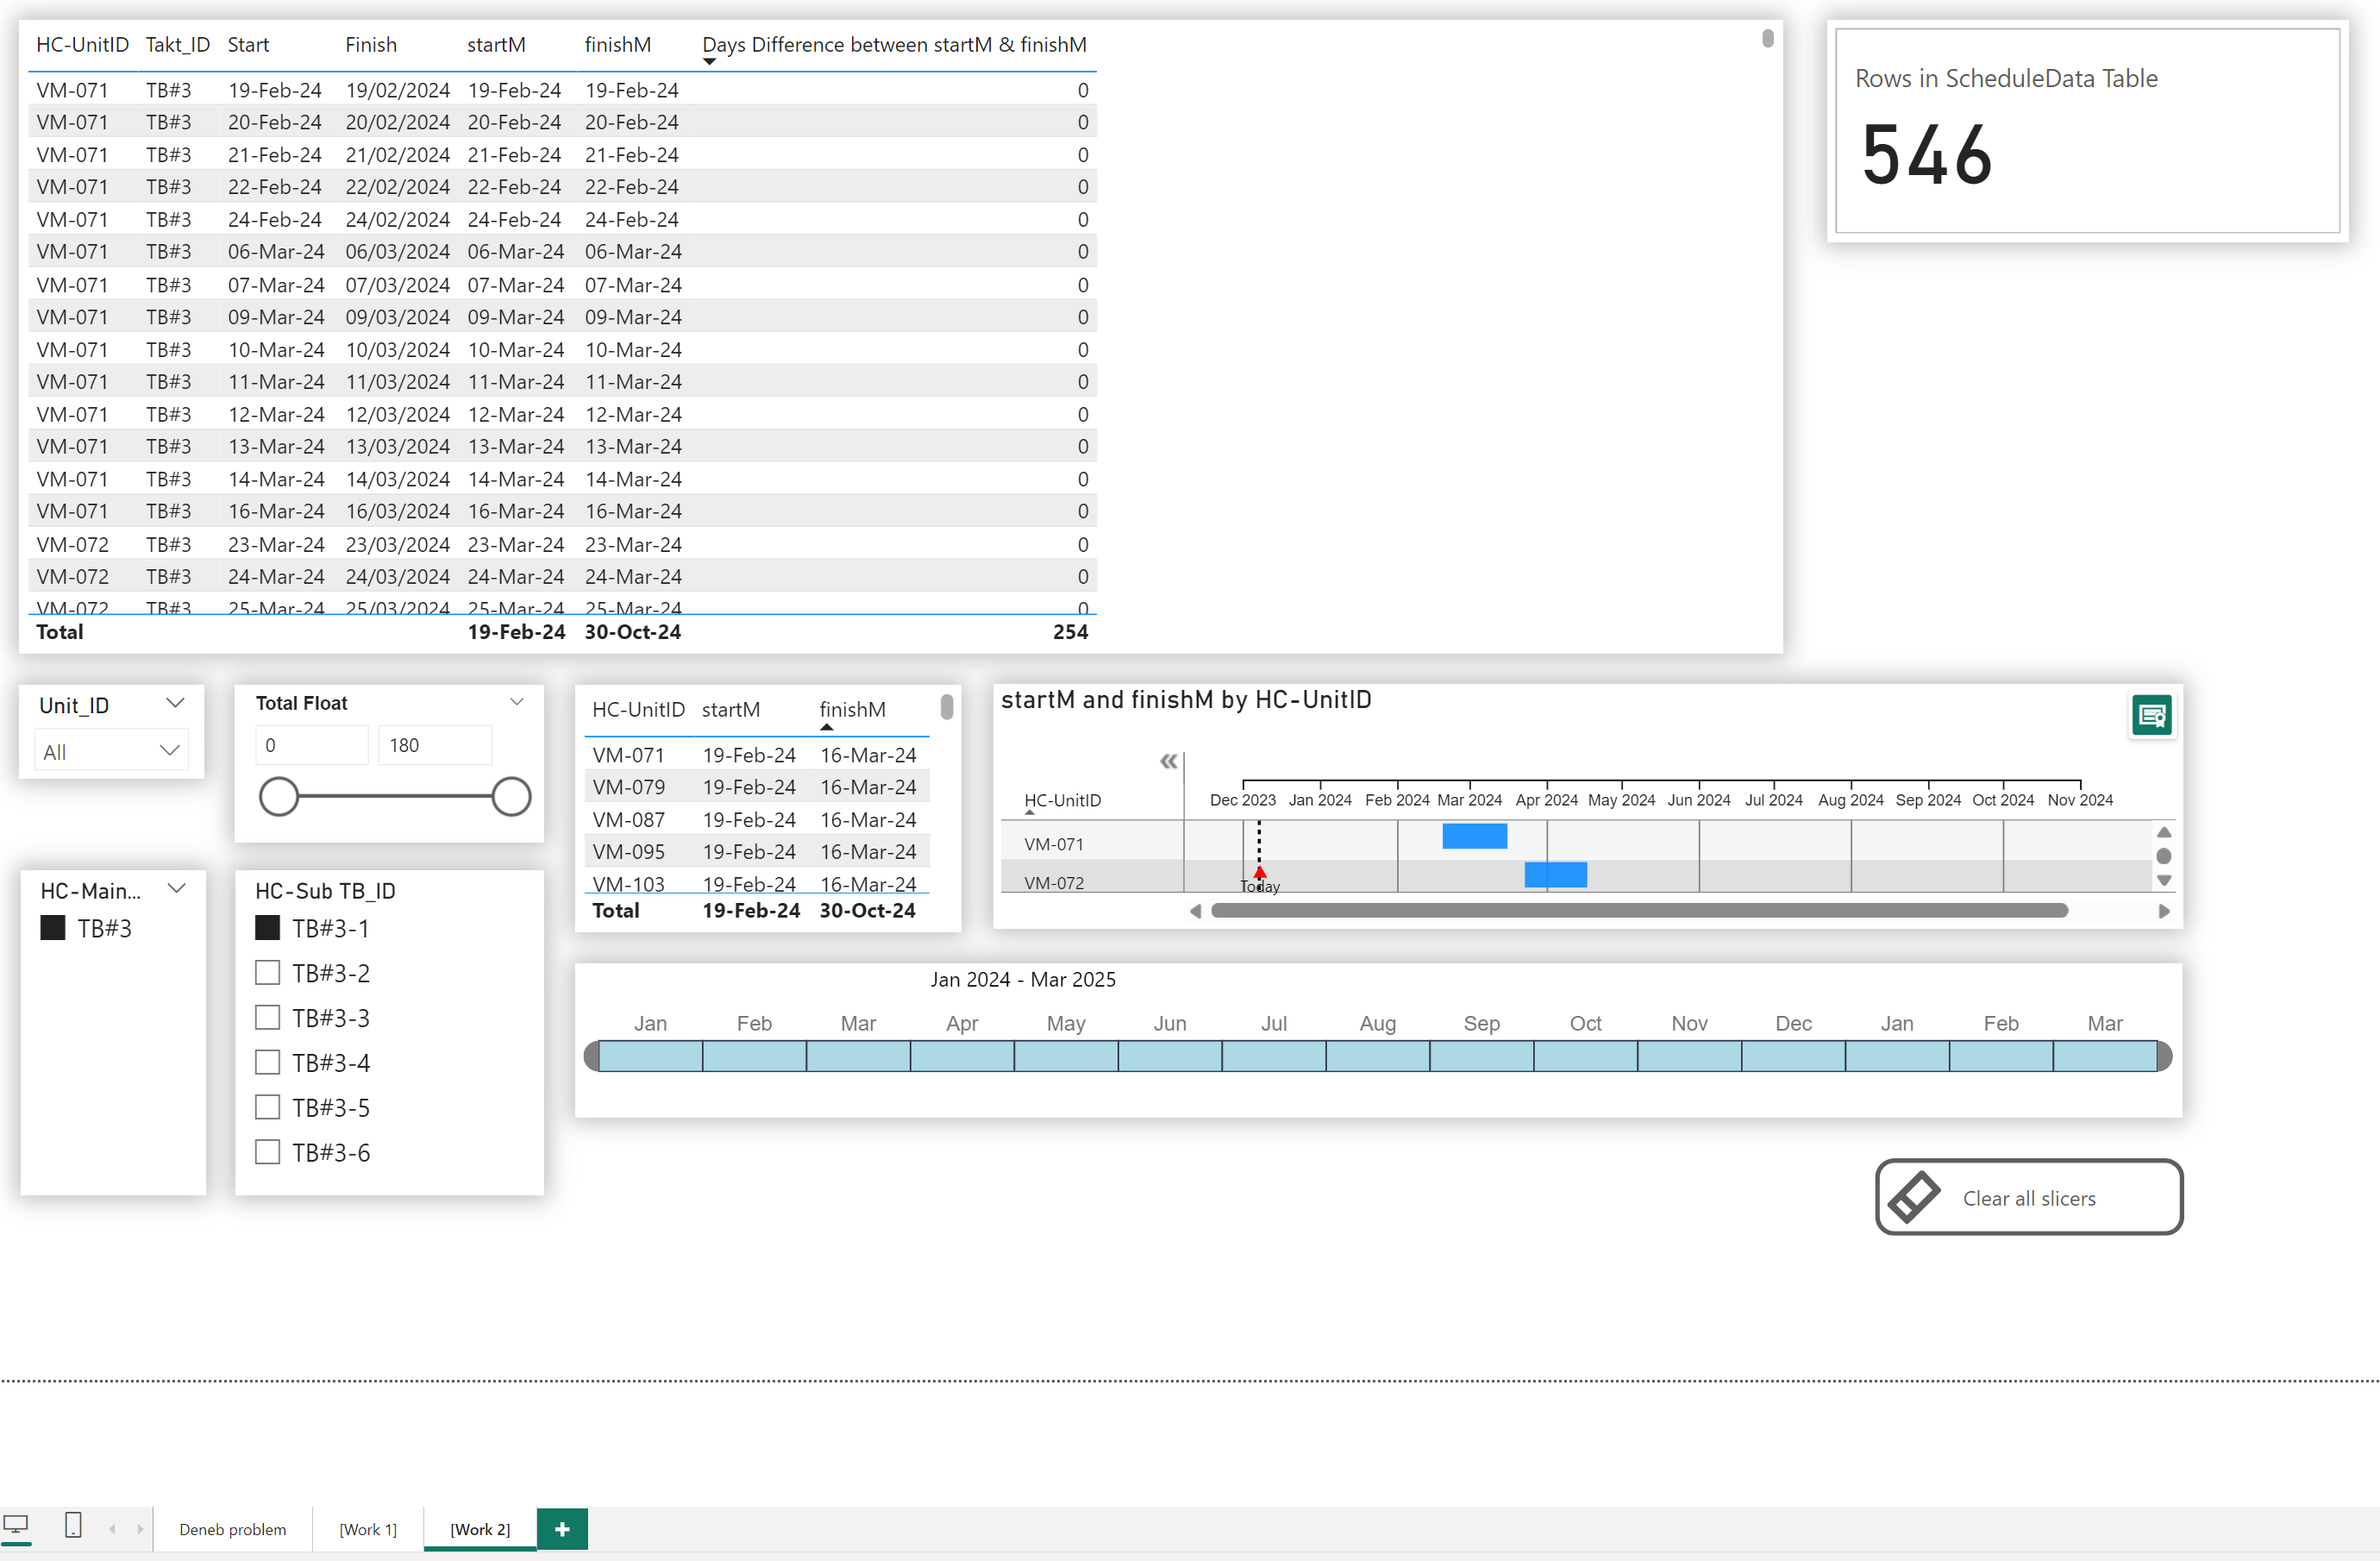
- when a task/subtask is selected (e.g., TB #3/TB#3-1) that has a zero difference in days between the start and finish dates, the bars do not display
Although both of these selections result in 546 records, I’m guessing Deneb automatically filters-out those with zero duration, hence no display.
Thanks for highlighting the problem. The issue was some of the duration interval in the Excel were 0.5 days which was converted to Zero duration when imported to PowerBI. I have now amended this duration to read as 1 day.
Further I have amended the Finish Date measure as Start + Av Duration. The graphs works as required.
Again thanks for the suggested amendments in the code line for constant Y axis. It reads better. Much Appreciated.