Deneb - Text marks layering

Hi everyone

I am trying to add some text comments to the charts. And everything works as expected:

But if I add the dates field, then my text starts layering:

So, do I need to aggregate this text in some way? Or how to add text boxes with random texts ( not from dataset fields)

Hi @craig.sanford.

To help us further analyze your current state and visualize your issue, could you please provide as many as you can of:

  • Your work-in-progress PBIX file, using sanitized data if necessary
  • Your dataset as an Excel file (again, sanitized if necessary)
  • A detailed mock-up (marked-up screenshot of the visual in question or Excel or PowerPoint file) showing your desired outcome.

Also, if you provide Deneb JSON code in your post, please format it using the built-in formatter.

Greg
_eDNA Forum - Format DAX or PQ

Hi

I created a PBIX file to visualize my issue.
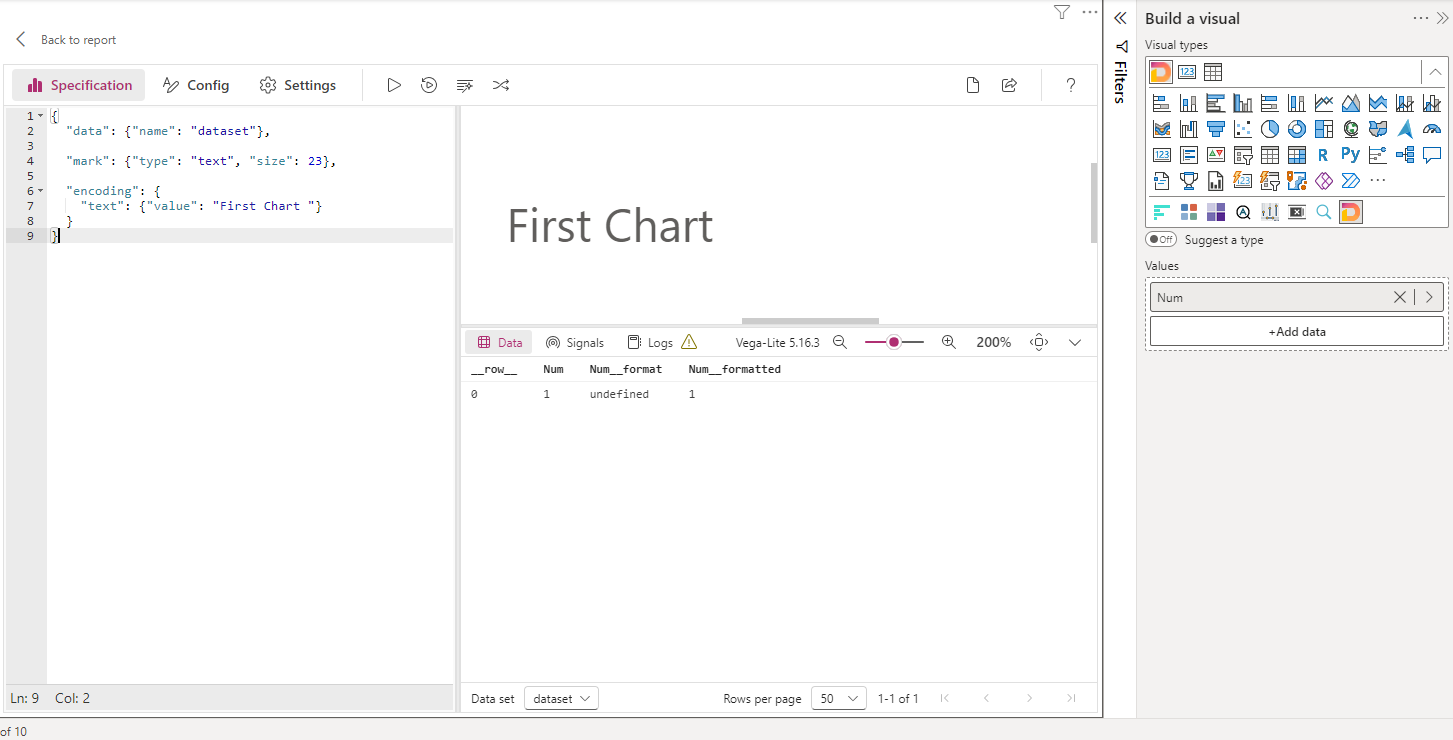
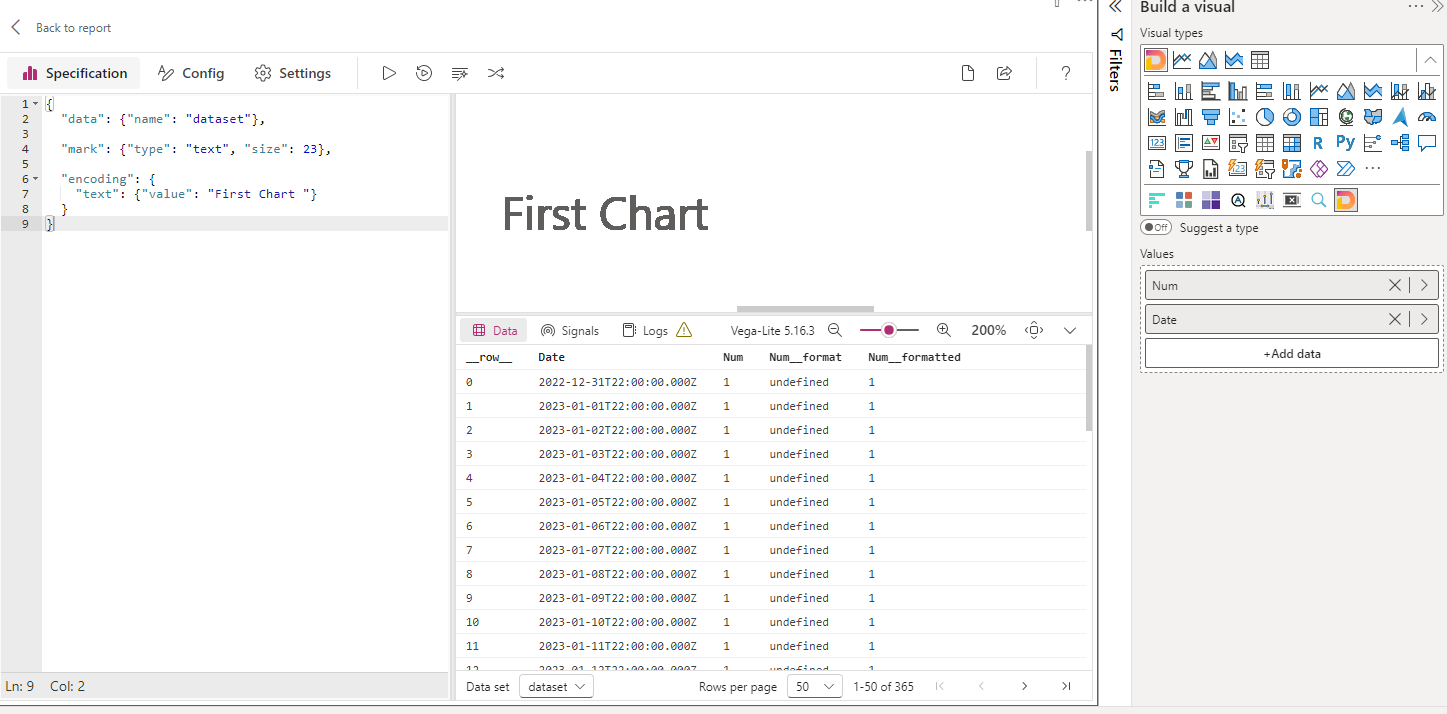
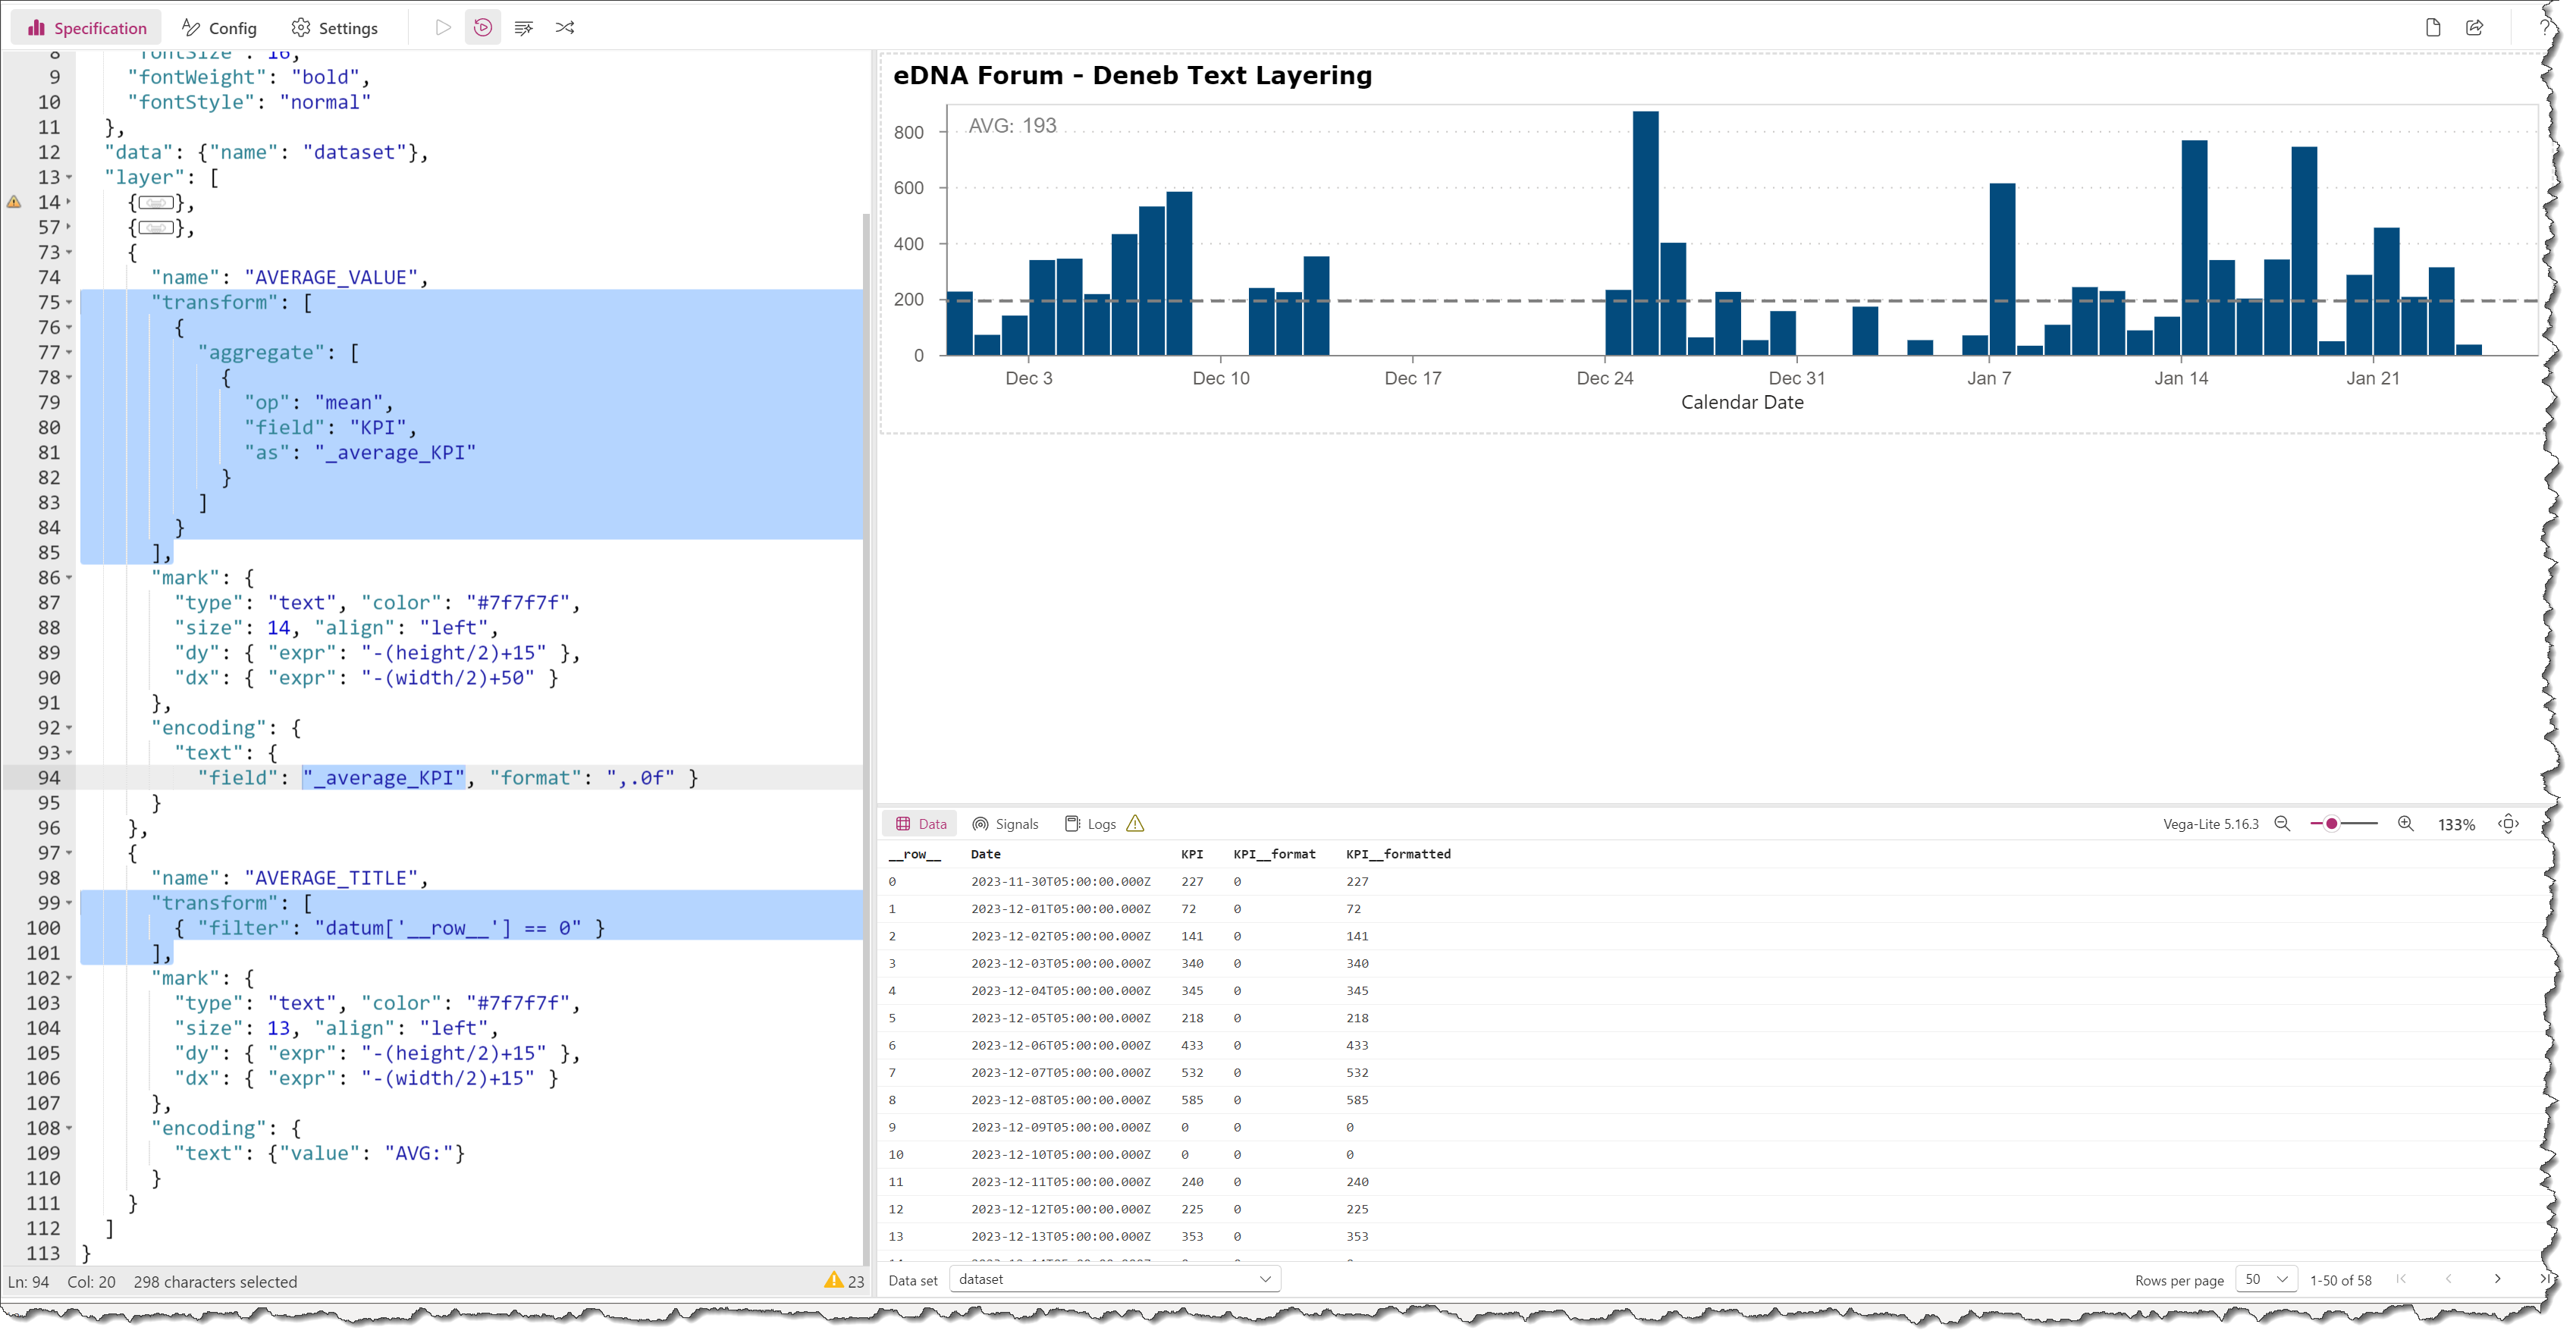
As you can see on the screenshot, the text is not smooth due to layering a lot of the same text.
Demo.pbix (5.4 MB)

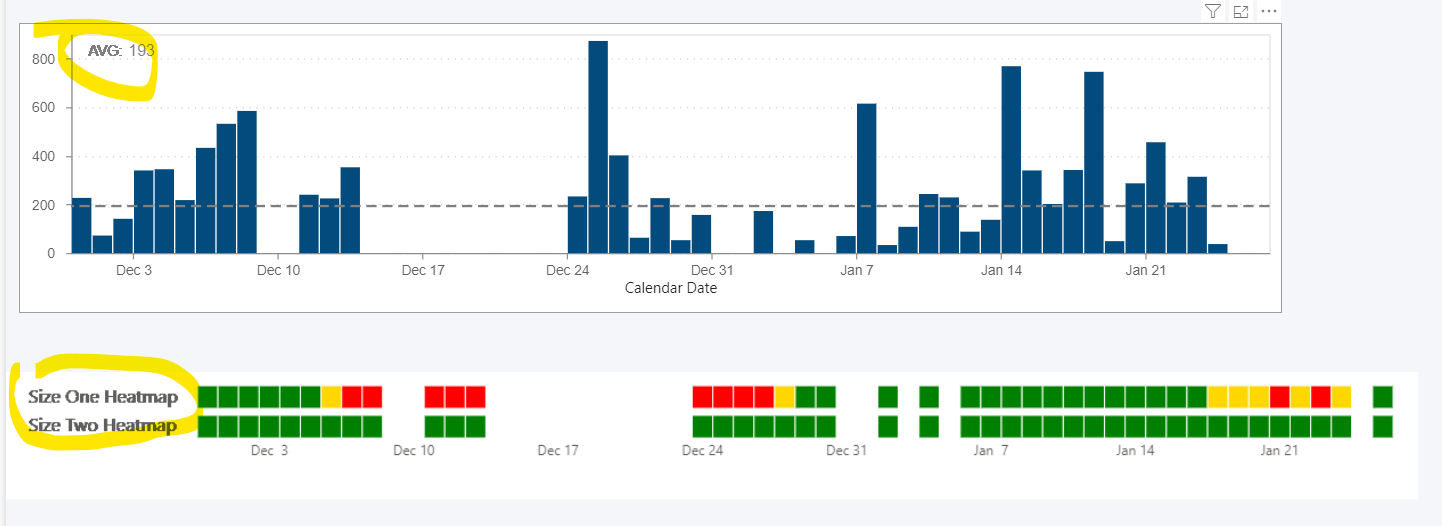
Here is a vega-lite code for heatmap

{
  "data": {"name": "dataset"},
  "hconcat": [
    {
      "vconcat": [
        {
          "mark": {
            "type": "text",
            "align": "left",
            "fontSize": 16
         
          },
          "encoding": {
            "text": {
              "value": "Size One Heatmap"
            }
          }
        },
        {
          "mark": {
            "type": "text",
            "align": "left",
            "fontSize": 16
          },
          "encoding": {
            "text": {
              "value": "Size Two Heatmap"
            }
          }
        }
      ],
      "spacing": 5
    },
    {
      "vconcat": [
        {
          "mark": {
            "type": "rect",
            "stroke": "white",
            "strokeWidth": 1
          },
          "width": 1050,
          "height": 20,
          "encoding": {
            "opacity": {
              "condition": {
                "test": {
                  "field": "__selected__",
                  "equal": "off"
                },
                "value": 0.1
              },
              "value": 1
            },
            "x": {
              "field": "Date",
              "title": null,
              "scale": {"zero": false},
              "axis": null
            },
            "tooltip": [
              {
                "field": "Date",
                "type": "temporal",
                "title": "Date"
              },
              {
                "field": "Size_1",
                "type": "ordinal",
                "title": "level"
              }
            ],
            "color": {
              "field": "Size_1",
              "title": "  ",
              "scale": null,
              "condition": [
                {
                  "test": "datum['Size_1'] === 'NA'",
                  "value": "white"
                },
                {
                  "test": "datum['Size_1'] === 'n'",
                  "value": "grey"
                },
                {
                  "test": "datum['Size_1'] === 'l'",
                  "value": "green"
                },
                {
                  "test": "datum['Size_1'] === 'm'",
                  "value": "gold"
                },
                {
                  "test": "datum['Size_1'] === 'h'",
                  "value": "red"
                }
              ]
            }
          }
        },
        {
          "mark": {
            "type": "rect",
            "stroke": "white",
            "strokeWidth": 1
          },
          "width": 1050,
          "height": 20,
          "encoding": {
            "opacity": {
              "condition": {
                "test": {
                  "field": "__selected__",
                  "equal": "off"
                },
                "value": 0.1
              },
              "value": 1
            },
            "x": {
              "field": "Date",
              "timeUnit": "yearmonthdate",
              "type": "ordinal",
              "title": null,
              "scale": {"zero": false},
              "axis": {
                "labelPadding": 5,
                "labelAngle": 0,
                "labelExpr": "[timeFormat(datum.value, '%w') == '0' ? timeFormat(datum.value, '%b %e') : '']"
              }
            },
            "tooltip": [
              {
                "field": "Date",
                "type": "temporal",
                "title": "Date"
              },
              {
                "field": "Size_2",
                "type": "ordinal",
                "title": "level"
              }
            ],
            "color": {
              "field": "Size_2",
              "title": "  ",
              "scale": null,
              "condition": [
                {
                  "test": "datum['Size_2'] === 'NA'",
                  "value": "white"
                },
                {
                  "test": "datum['Size_2'] === 'n'",
                  "value": "grey"
                },
                {
                  "test": "datum['Size_2'] === 'l'",
                  "value": "green"
                },
                {
                  "test": "datum['Size_2'] === 'm'",
                  "value": "gold"
                },
                {
                  "test": "datum['Size_2'] === 'h'",
                  "value": "red"
                }
              ]
            }
          }
        }
      ],
      "spacing": 2
    }
  ],
  "spacing": 15
}

and for bar chart

{
  "data": {"name": "dataset"},

  "layer": [
    {
      "mark": {
        "type": "bar",
        "size": 17
      },
      "width": 1100,
      "encoding": {
        "x": {
          "field": "Date",
          "type": "temporal",
          "timeUnit": "yearmonthdate",
          "scale": {"zero": false},
          "axis": {
            "labelPadding": 5,
            "labelAngle": 0,
            "tickCount": 7,
            "grid": false,
            "labelExpr": "[timeFormat(datum.value, '%w') == '0' ? timeFormat(datum.value, '%b %e') : '']"
          },
          "title": "Calendar Date"
        },
        "y": {
          "field": "KPI",
          "type": "quantitative",
         
          "title": null
        },
        "color": {"value": "#034b7d"},
        "tooltip": [
          {
            "field": "Date",
            "type": "temporal",
            "title": "."
          },
          {
            "field": "KPI",
            "type": "ordinal",
            "format": ".0f",
            "title": " "
          }
        ]
      }
    },
    {
      "mark": {
        "type": "rule",
        "strokeDash": [9, 5],
        "color": "#7f7f7f",
        "size": 2
      },
      "encoding": {
        "y": {
          "aggregate": "average",
          "field": "KPI",
          "type": "quantitative"
        }
      }
    },
    {
      "mark": {
        "type": "text",
        "color": "#7f7f7f",
        "size": 14,
        "align": "left", 
        "dy": { "expr": " -(height/2)+15 "},
        "dx": { "expr": " -(width/2)+50 "}
      },
      "encoding": {
        "text": {
          "field": "KPI",
          "aggregate": "average",
          "format": ",.0f"
        }
      }
    },
        {
      "mark": {
        "type": "text",
        "color": "#7f7f7f",
        "size": 13,
        "align": "left", 
        "dy": { "expr": " -(height/2)+15 "},
        "dx": { "expr": " -(width/2)+15 "}
      },
      "encoding": {
        "text": {
          "value": "AVG:"
        }
      }
    }
  ]
}

Hi @craig.sanford

You are getting text mark “layering” as Vega-Lite creates a text mark for every row in the dataset. One way to resolve this is to use the aggregate/mean transform instead of aggregate encoding, thus your dataset will be only 1 row. In the text mark for the average label, you’ll again need only 1 row, so one ways is to use the filter transform. Here’s what I came up with:

Hope it helps.
Greg
eDNA Forum - Deneb Text Layering.pbix (5.5 MB)

Wow! I’ve figured out how to add aggregation for values, but I haven’t seen this structure before

 "transform": [
        { "filter": "datum['__row__'] == 0" }
      ]

that’s exactly what I need. I wouldn’t have thought of it myself!
Thank you