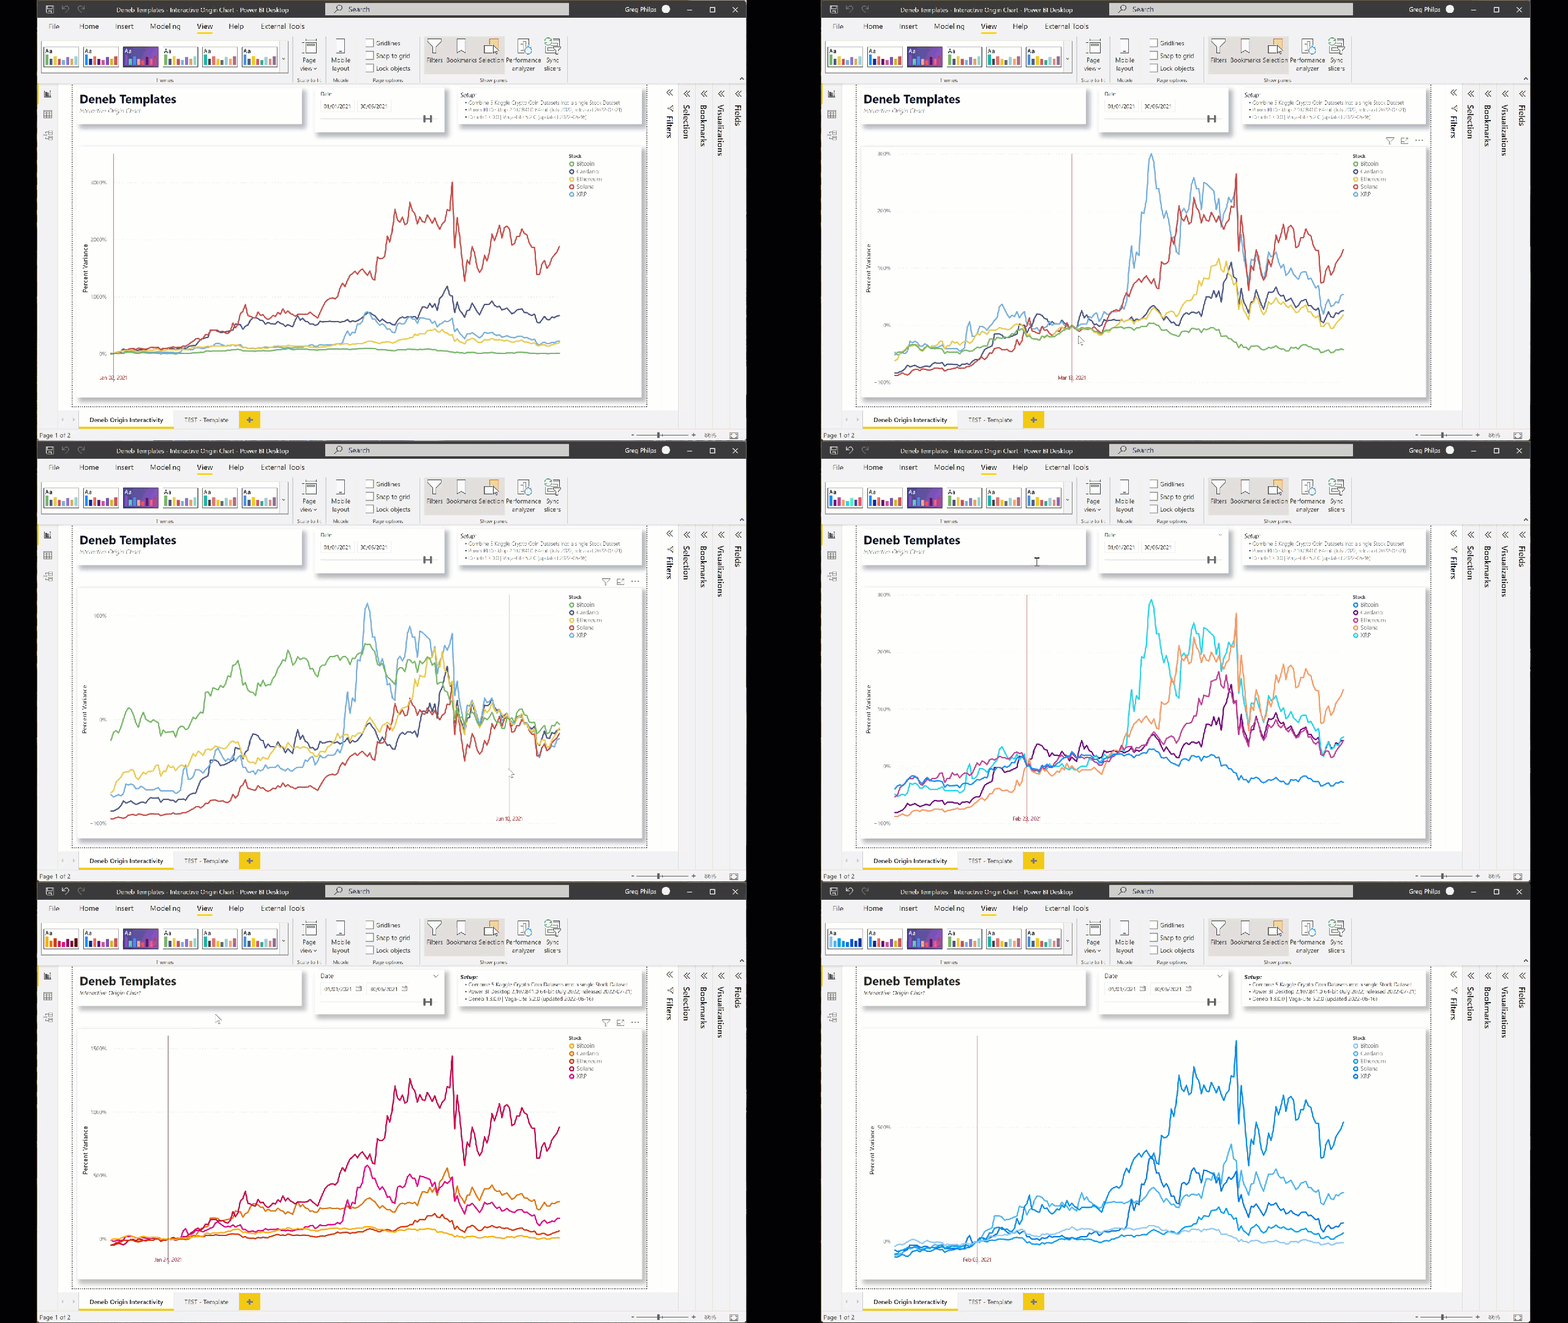
I’m continuing my exploration of the interactivity features built-in to the Vega-Lite language, and wanted to share a particular use case that I found interesting: an interactive origin in line charts. Using the “Interactive Index Chart” example from the Vega-Lite website as a starter
and sourcing some sample cryptocurrency stock prices from Kaggle, I essentially did a copy-and-paste of the example Vega-Lite code and the automatic field mapping provided by Deneb did the rest and this chart worked first time. I made a few changes for personal clarification, but otherwise, the Vega-Lite code is stock and unchanged.
This chart, instead of presenting the “Price” value on the Y-axis, presents that % change compared to the “origin” day. The “origin” day is dynamic and responds to the position of the mouse (the “mouseover” event).

Attached is a Deneb template for creating such an interactive origin chart.
This template illustrates a number of Deneb/Vega-Lite features, including:
- 3 marks in a layer (origin point [top, hidden]; line chart [middle]; origin vertical line and label [bottom])
- the origin point is determined by the x-coordinate of the mouse position and is fully transparent (opacity = 0)
- the line charts of stock price as a percentage of the selected “zero” value (from the origin point selected above)
- the origin vertical line and text label indicating the date of the selected “zero” point
- a transform block in the [line charts layer] to extend the provided dataset by calculating the percentage change from the selected origin date
- (facilitated by Deneb v1.1 and above) the use of the current Power BI theme to set the colours of the lines
- a transform block in the [origin vertical line and text label layer] to filter the dataset to only the selected origin x-coordinate
The intent of this template is not to provide a finished visual, but rather to serve as a starting point for further custom visual development.
Also included is the sample PBIX using a dataset composed of the 5 crypto coin CSV files sourced from Kaggle.
NOTE: This template is provided as-is for information purposes only, and its use is solely at the discretion of the end user; no responsibility is assumed by the author.
Greg
deneb.interactive_origin_chart.0.2.json (15.0 KB)
Deneb Templates - Interactive Origin Chart.pbix (1.7 MB)
crypto.csv (1.2 MB)