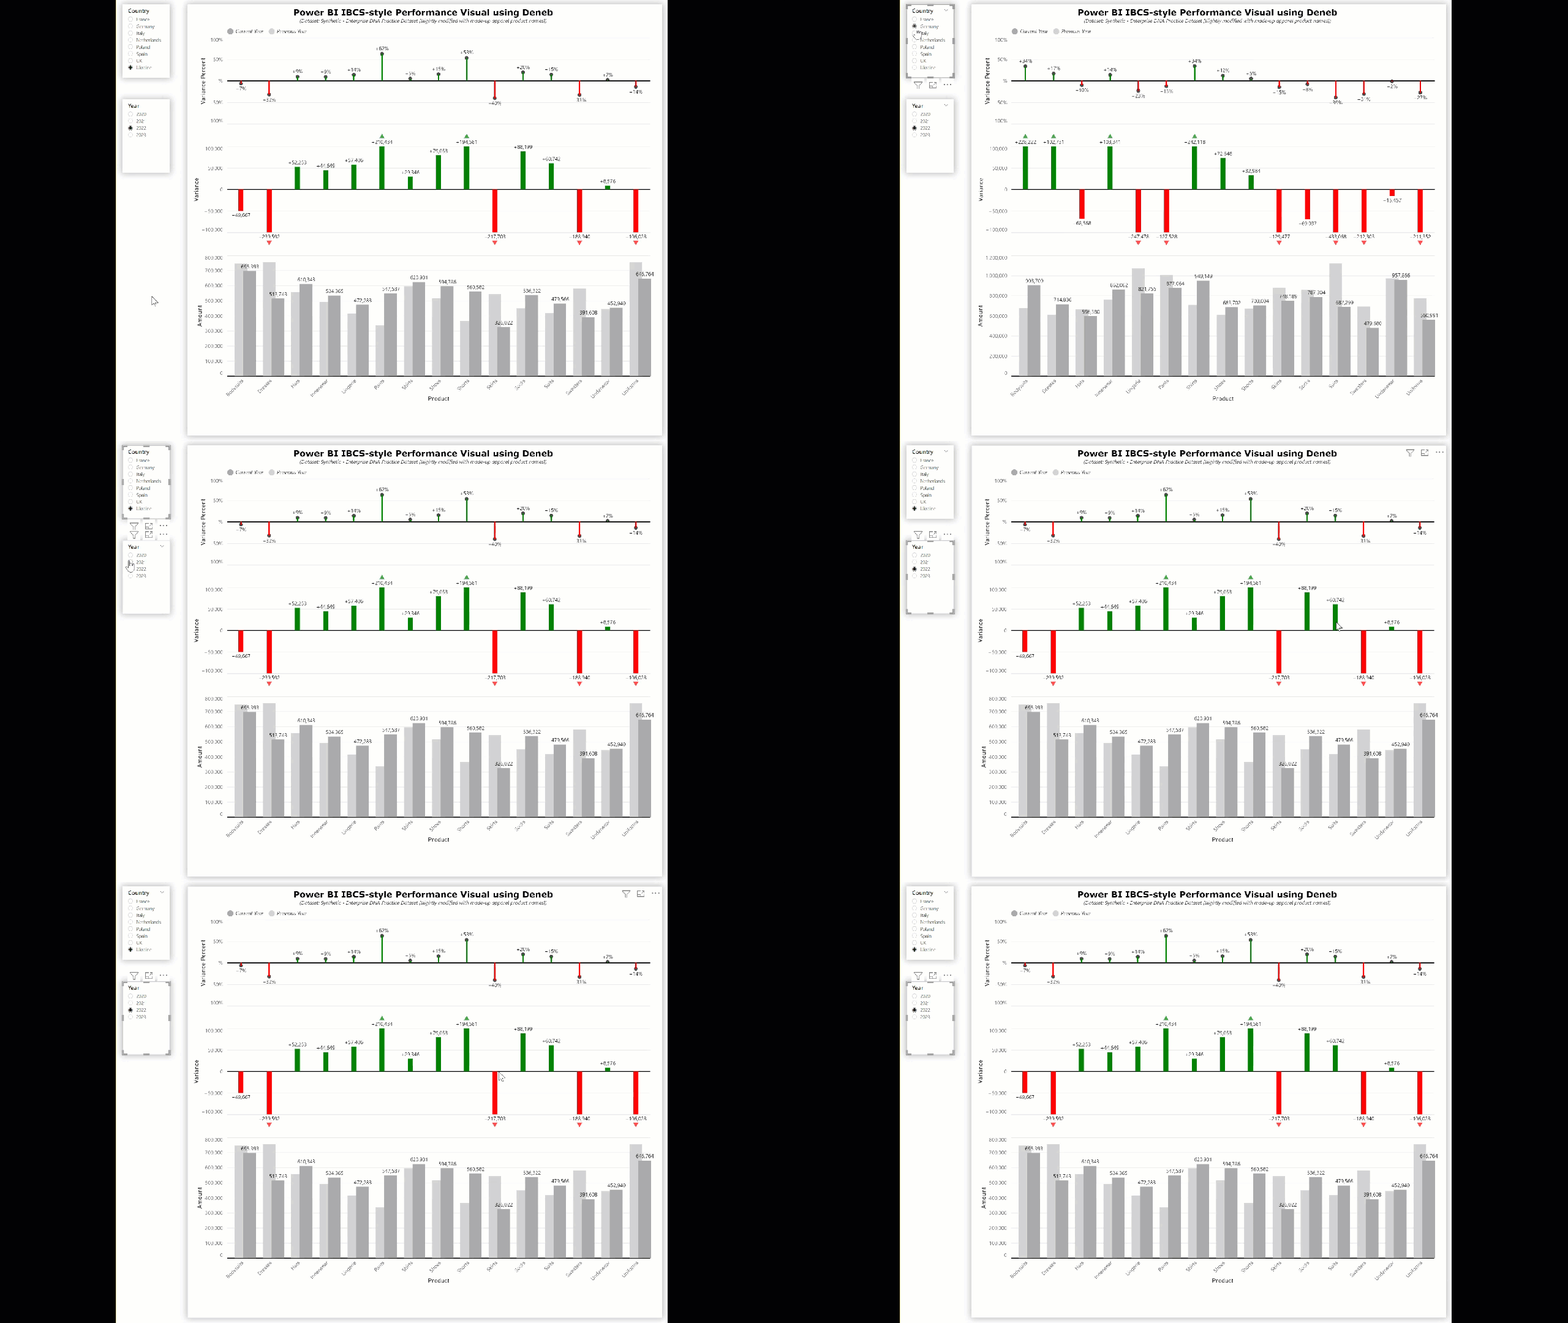
The IBCS standard can enhance the clarity of visualizing relative performance by distilling it to its essence, and I enclose a Deneb/Vega-Lite template for such an IBCS-style visual. This is a single composite visual that’s been provided with only category (product), current year (Sales CY), and previous year (Sales PY) data values.

This template illustrates a number of Deneb/Vega-Lite features, including:
- a “title” block with title and subtitle text
- a “transform” block to extend the dataset through calculation of the variance amount and variance percent and threshold variance amount and variance percent (in this example, $100,000 and 100%, respectively)
- a “params” block to set colour values (green/positive, red/negative, dark grey/current year, light grey/previous year) to ensure consistency
- a “vconcat” (vertical concatenation) of a custom legend and 3 separate chart “blocks”: absolute sales on the bottom, variance amount in the middle, and variance percent on top using standard IBCS colours and shapes
- each chart block in turn consists of layered bar, point, and text marks
- use of “conditions” to set the display colour of variance outlier (above threshold) indicators
- although unnecessary for an IBCS-style visual, gridlines were included with wide-black at Y=0 and normal-grey otherwise
- the X-axes for both the top and middle chart were hidden as the inherent alignment that Vega-Lite brings to composite visuals makes them redundant
- the X-axis labels for the bottom chart were angled to reduce the visual height
- Vega-Lite formatting of the variance amounts and percentages to enable signed values
- a Deneb custom tooltip on each bar chart showing extended dataset fields, including Deneb formatting of the amount and percent values using Power BI formatting strings
This example uses only the simplest of DAX code:
Sales CY =
SUMX(
    Sales,
    Sales[Order Quantity] * Sales[Unit Price]
)

Sales PY =
CALCULATE(
    [Sales CY],
    DATEADD( Dates[Date], -1, YEAR )
)
The intent of this template is not to provide a finished visual, but rather to serve as a starting point for further custom visual development.
Also included is the sample PBIX using a slightly-modified version of the Enterprise DNA practice dataset as a demo.
This template is provided as-is for information purposes only, and its use is solely at the discretion of the end user; no responsibility is assumed by the author.
Greg
deneb.ibcs_performance_visual.0.2.json (18.4 KB)
Deneb Templates - IBCS.pbix (1.8 MB)
