In the following code, the text mark refers to the orange ticks. Why isn’t it following the alignment correctly? For each tick, the distance beetween the text and the tick is different.
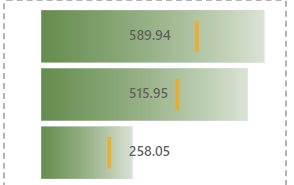
I tried copying the code into another pbix but it was all messed up, don’t know why, so I hope the code is enough =)
Code
{
  "data": {"name": "dataset"},
  "layer": [
    {
      "mark": {
        "type": "bar",
        "opacity": 0.3,
        "tooltip": true
      },
      "encoding": {
        "x": {"field": "Faturamento", "axis": null}
      }
    },

    {
      "mark": {
        "type": "bar",
        "tooltip": true,
        "color": {
      "x1": 0,
      "x2": 1,
      "y1": 0,
      "y2": 0,
      "gradient": "linear",
      "stops": [
        {
          "offset": 0,
          "color": "rgba(76, 122, 42, 0.8)"
        },


        {
          "offset": 1,
          "color": "rgba(218, 227, 212, 1)"
        }
      ]
    }
      },
      "encoding": {
        "x": {
          "field": "Faturamento__highlight"
        },
        "opacity": {
          "condition": {
            "test": {
              "field": "__selected__",
              "equal": "off"
            },
            "value": 0
          },
          "value": 1
        }
      }
    },
    {
      "mark": {"type": "tick", "tooltip": true, "color": "orange", "thickness": 3, "height": 25},
      "encoding": {"x": {"field": "Tons SOP"}}
    },

    {"mark": {"type": "text", "fontSize": 11, "fontWeight": 500, "align": "left", "dx": -25},
      "encoding": {"text": {"field": "Tons SOP", "type": "quantitative", "format": ".2f"}
    }}
  ],

  "encoding": {
    "y": {
      "field": "Centro Regiao",
      "type": "nominal",
      "title": null,
      "axis": {"labelColor": "white"},
      "sort": "Faturamento"
    },
    "x": {
      "type": "quantitative",
      "axis": {"title": "Faturamento"}
    }
  }
}