[Deneb Question] How to add Constant Horizontal Line

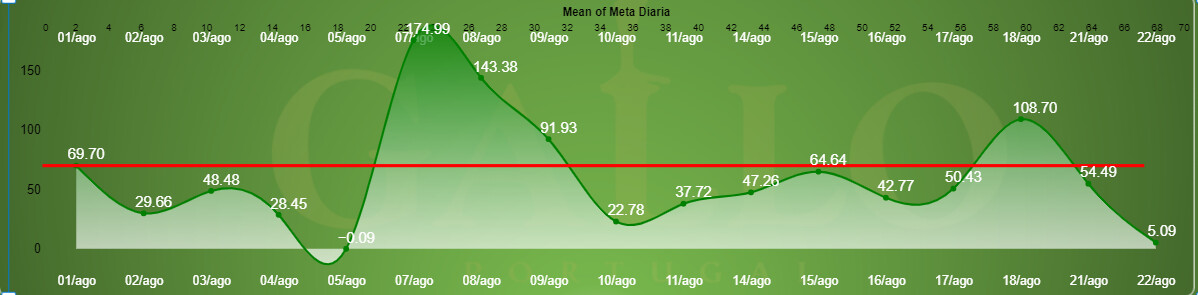
Hi, I would like to put an horizontal line on the area chart representing the monthly goal, which should be a constant value for the entire month, like on this pic below (the pic below is not an area chart, but shows the line properly):

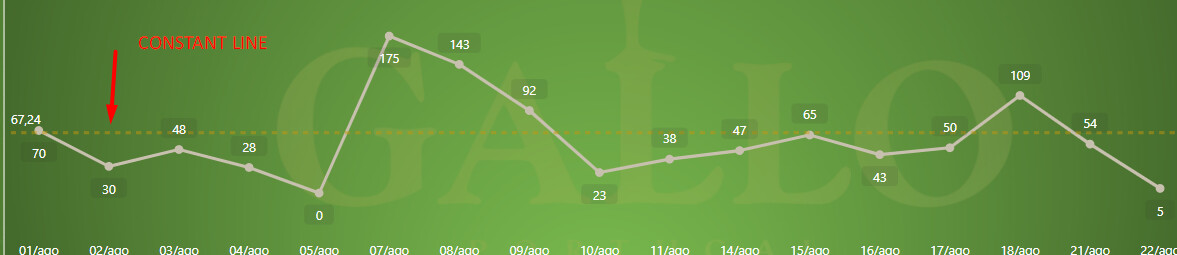
The code is below (I tried using rules, etc, but was not successfull):

Vega Lite Code

{
“data”: {“name”: “dataset”},
“config”: {
“view”: {“stroke”: “transparent”}
},
“layer”: [
{
“mark”: {
“type”: “area”,
“interpolate”: “natural”,
“point”: {“color”: “green”},
“tooltip”: true,
“grid”: null,
“line”: {“color”: “green”},
“color”: {
“x1”: 0,
“x2”: 0,
“y1”: 0,
“y2”: 1,
“gradient”: “linear”,
“stops”: [
{
“offset”: 0,
“color”: “green”
},
{
“offset”: 1,
“color”: “white”
}
],
“point”: {
“filled”: true,
“color”: “#4B7430
}
}
}
},
{
“mark”: {“type”: “rule”, “color”: “red”},
“encoding”: {“y”: {“datum”: 12, “type”: “quantitative”}},
“tooltip”: true
},
{
“mark”: {
“type”: “text”,
“dx”: -8,
“dy”: -10,
“color”: “white”,
“baseline”: “middle”,
“align”: “top”,
“fontSize”: 14
},
“encoding”: {
“text”: {
“field”: “Faturamento”,
“format”: “.2f”
}
}
}
],
“encoding”: {
“x”: {
“field”: “Dia Mes”,
“type”: “nominal”,
“axis”: {
“title”: null,
“labelAngle”: 0,
“labelColor”: “white”,
“labelFontSize”: 12
}
},
“y”: {
“field”: “Faturamento”,
“type”: “quantitative”,
“title”: null,
“axis”: {
“labelColor”: “black”,
“labelFontSize”: 12
}
}
}
}

Thanks

Hi @klein.keagan. Easily done … add a rule mark. Here’s one of the examples from the Vega-Lite website:

Hope this helps.
Greg

I managed to do it, however, as both x axis were overlapping and the bottom-most encoding was managing both x axis, I tried putting the rule mark outside of the layer, but then I got that {} error.

What is wrong with the code?
Thank you

Code not working

{
“data”: {“name”: “dataset”},
“config”: {
“view”: {“stroke”: “transparent”}
},

“layer”: [

{
  "mark": {
    "type": "area",
    "interpolate": "natural",
    "point": {"color": "green"},
    "tooltip": true,
    "grid": null,
    "line": {"color": "green"},
    "color": {
      "x1": 0,
      "x2": 0,
      "y1": 0,
      "y2": 1,
      "gradient": "linear",
      "stops": [
        {
          "offset": 0,
          "color": "green"
        },
        {
          "offset": 1,
          "color": "white"
        }
      ],
      "point": {
        "filled": true,
        "color": "#4B7430"
      }
    }
  }
},

{
  "mark": {
    "type": "text",
    "dx": -8,
    "dy": -10,
    "color": "white",
    "baseline": "middle",
    "align": "top",
    "fontSize": 14
  },
  "encoding": {
    "text": {
      "field": "Faturamento",
      "format": ".2f"
    }
  }
}

],

{
“mark”: “rule”,
“color”: “black”,
“encoding”: {
“x”: {
“aggregate”: “mean”,
“field”: “Meta Diaria”,
“type”: “quantitative”
},
“color”: {“value”: “red”},
“size”: {“value”: 3}
},
“tooltip”: true
},
“encoding”: {
“x”: {
“field”: “Dia Mes”,
“type”: “nominal”,
“axis”: {
“title”: null,
“labelAngle”: 0,
“labelColor”: “white”,
“labelFontSize”: 12
}
},
“y”: {
“field”: “Faturamento”,
“type”: “quantitative”,
“title”: null,
“axis”: {
“labelColor”: “black”,
“labelFontSize”: 12
}
}
}
}

Both the area mark and the rule mark need to be inside the layer to share axes.
Greg

I see. Now I need to get rid of the top labels :sweat_smile:

Looking good … set the axis to null in the rule mark block.
Greg

I still got the white top labels. I just want those labels on the bottom. Thank you =)

Send your PBIX (with sample or obfuscated data) and I’ll have a look in the morning. Greg

Thank you very much Greg. Unfortunately, can’t send that pbix specifically because it’s an actual real client :sweat_smile:

If there is an efficient way to mask the data, it can be great.

I put orient: bottom and the top axis vanished. Not sure it is the right way to do it.

Your help has been absolutely great, since there are very few people to live discuss and help with deneb, and I hope we get more people into this fantastic tool community.

I also hope I can continue to get help here :smile:

Today I don’t know how much time I will have to come here, but very soon I’m sure I will come with more questions haha.

Regards,
Claudio (I don’t know how to change my name here. It’s not klein hahah)

Hi Claudio. My guess is that when Vega-Lite saw the “orient”: “bottom”, it then saw that it already had an axis (and labels) there so didn’t need to write it again. (I’m not sure there is always/often a “right” way to do things in Vega-Lite; whenever I get something working, I run with it, so …)
Greg