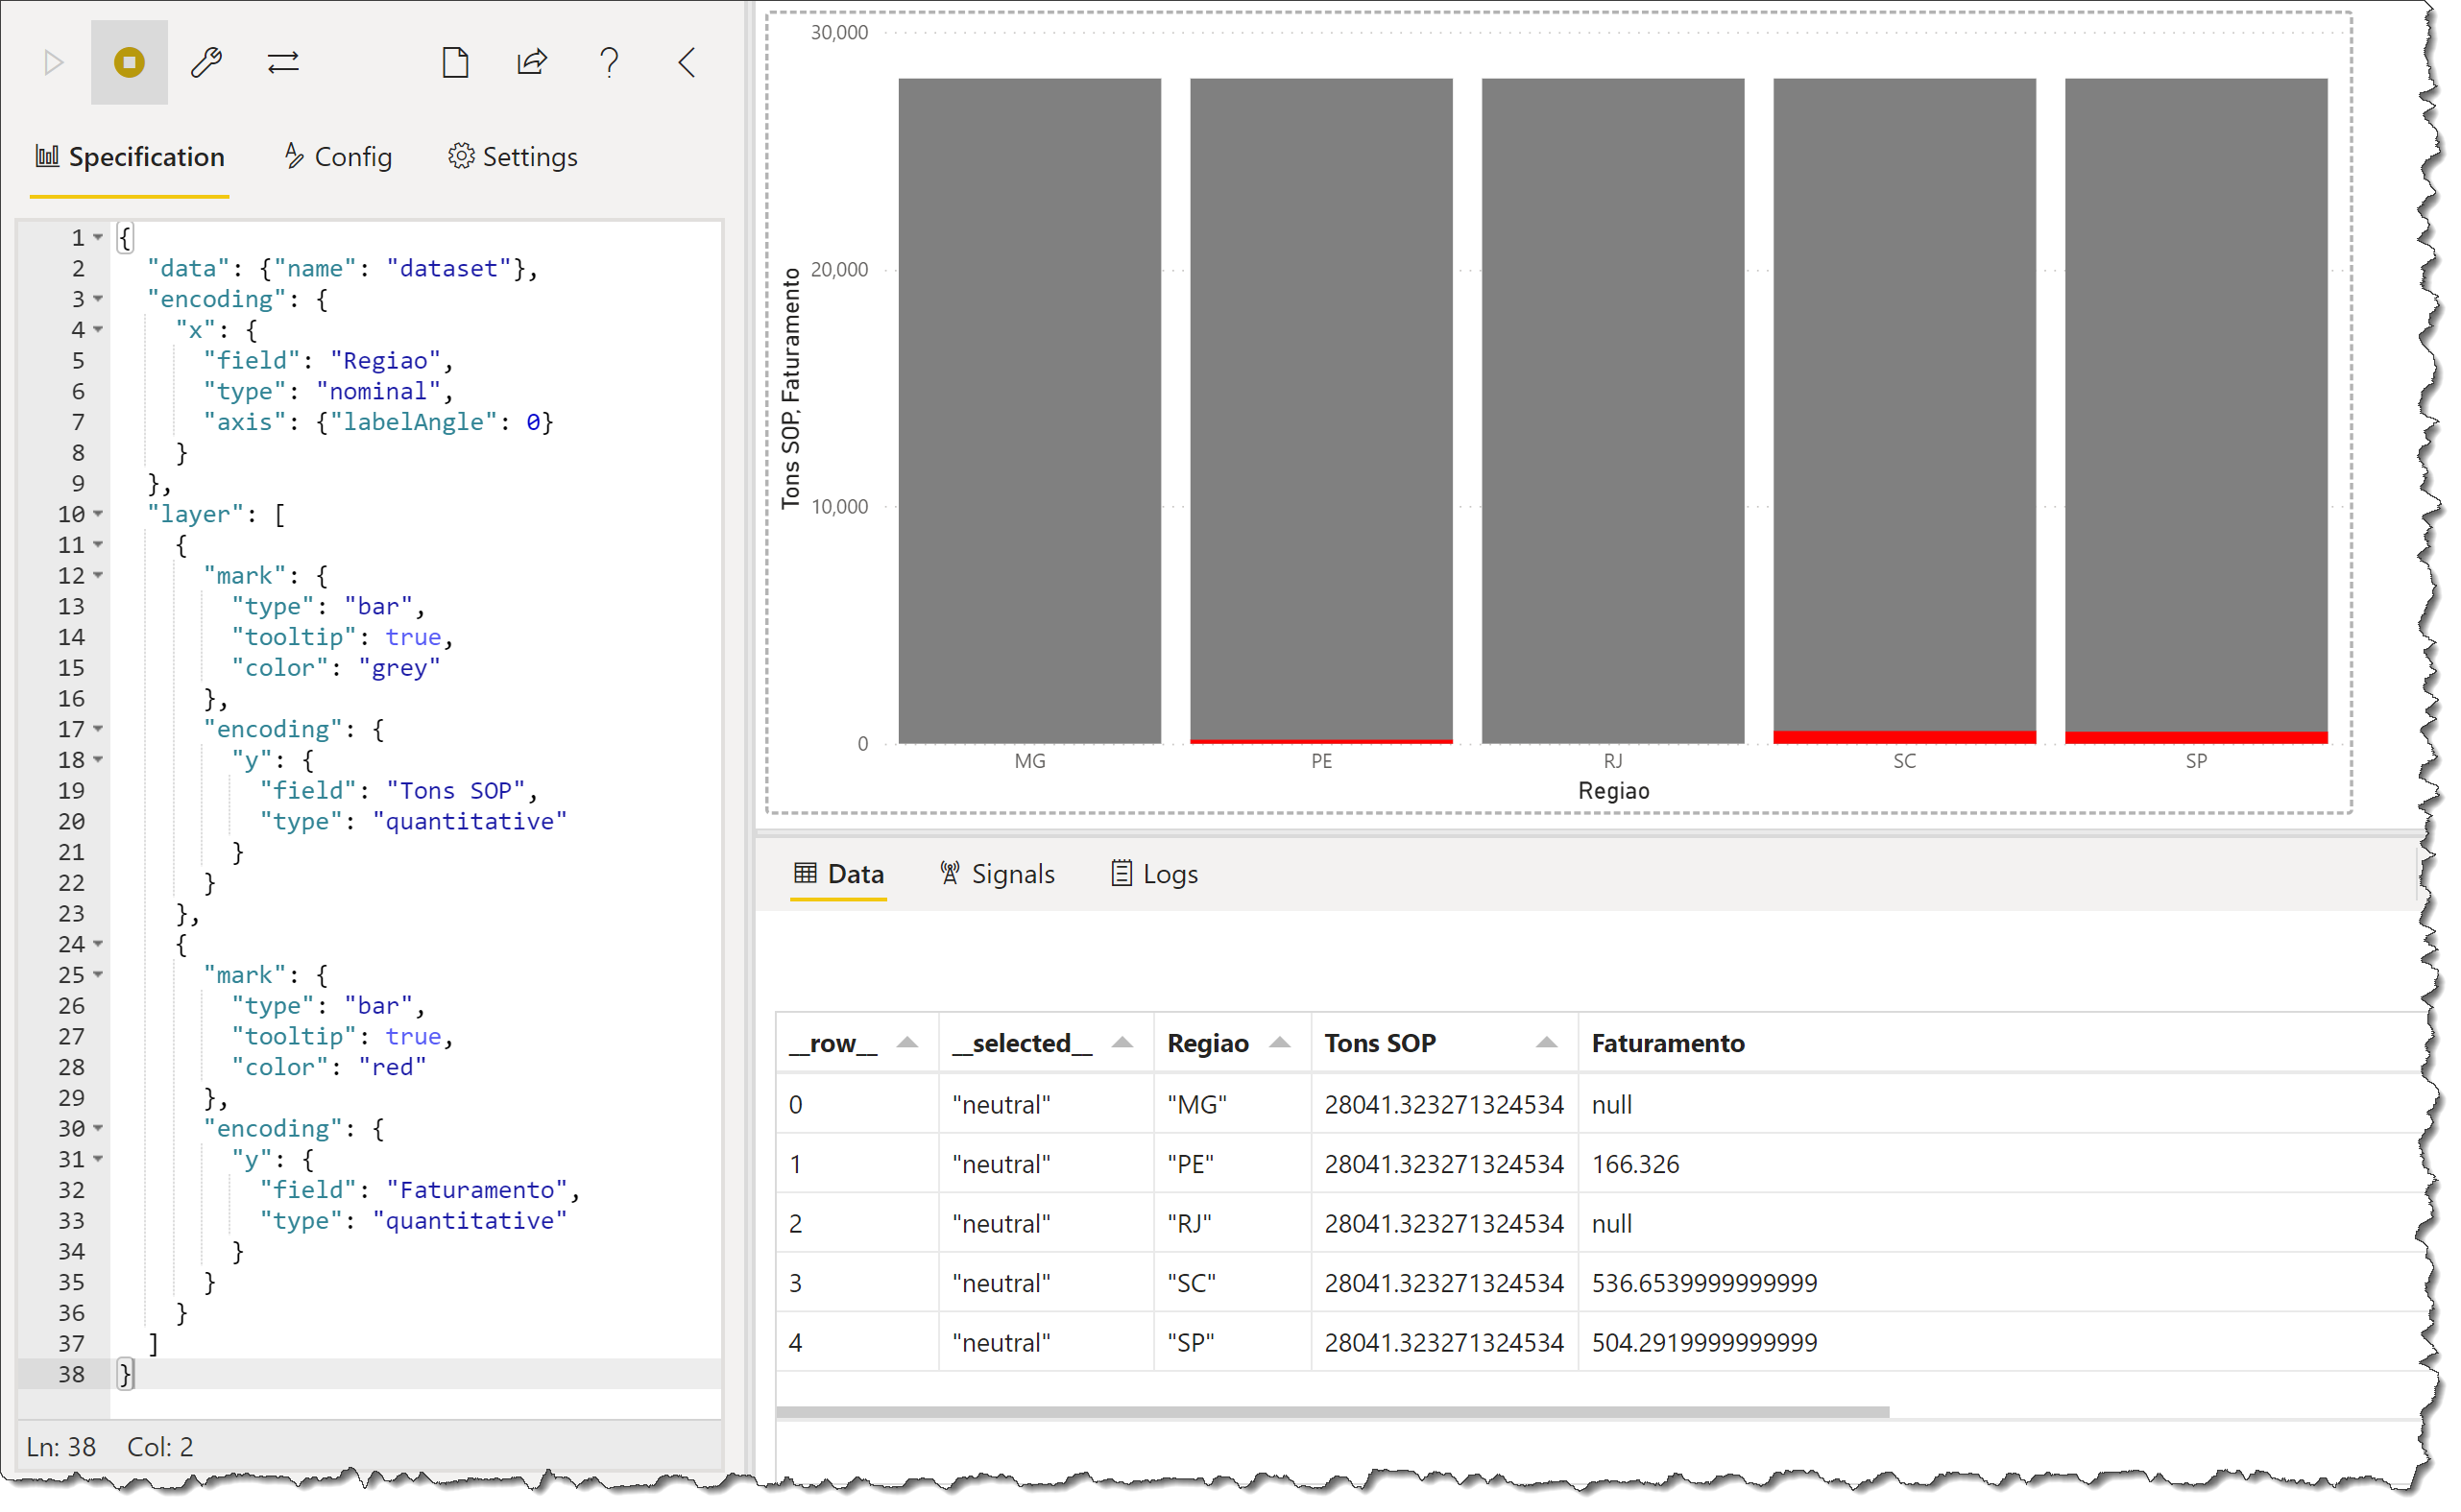
Hi. I want to make a vertical bullet chart using the following columns and measures from the pbix below:
dCentros[Regiao] as the category
Faturamento as the main measure
Tons SOP as the goal/target measure
I have looked on multiple places, including @Greg workout, but even copying and editing the code has not been solving my problem and I am feeling kinda frustrated for working so hard over the past weeks not beeing able to do such a simple thing.
I always create a table first to make sure I have the data correct before I convert the table to a Deneb visual and begin the Deneb/Vega-Lite adjustments.
Make a standard Power BI table with the columns/measures you want, then use the Visual Gallery (in the centre of the “Home” toolbar) to change the table visual to a Deneb visual.
Greg