Deneb - Marimekko Chart Tweak

Hi,

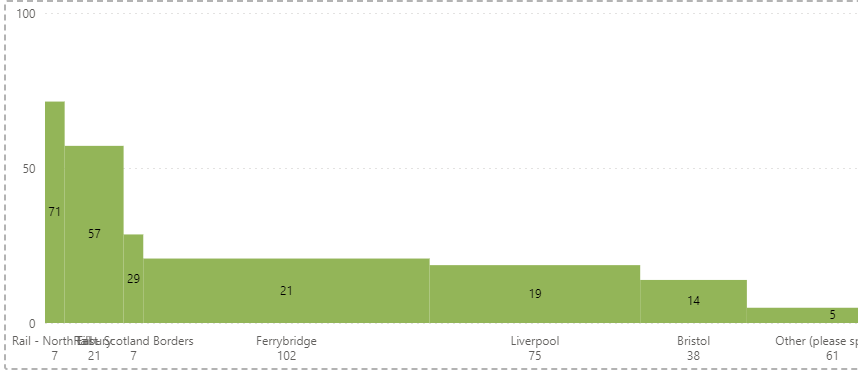
I’ve tweaked the code very basically so the axis starts at Zero, this is because we want to display all positive NPS scores on one graph and the negatives on the other.

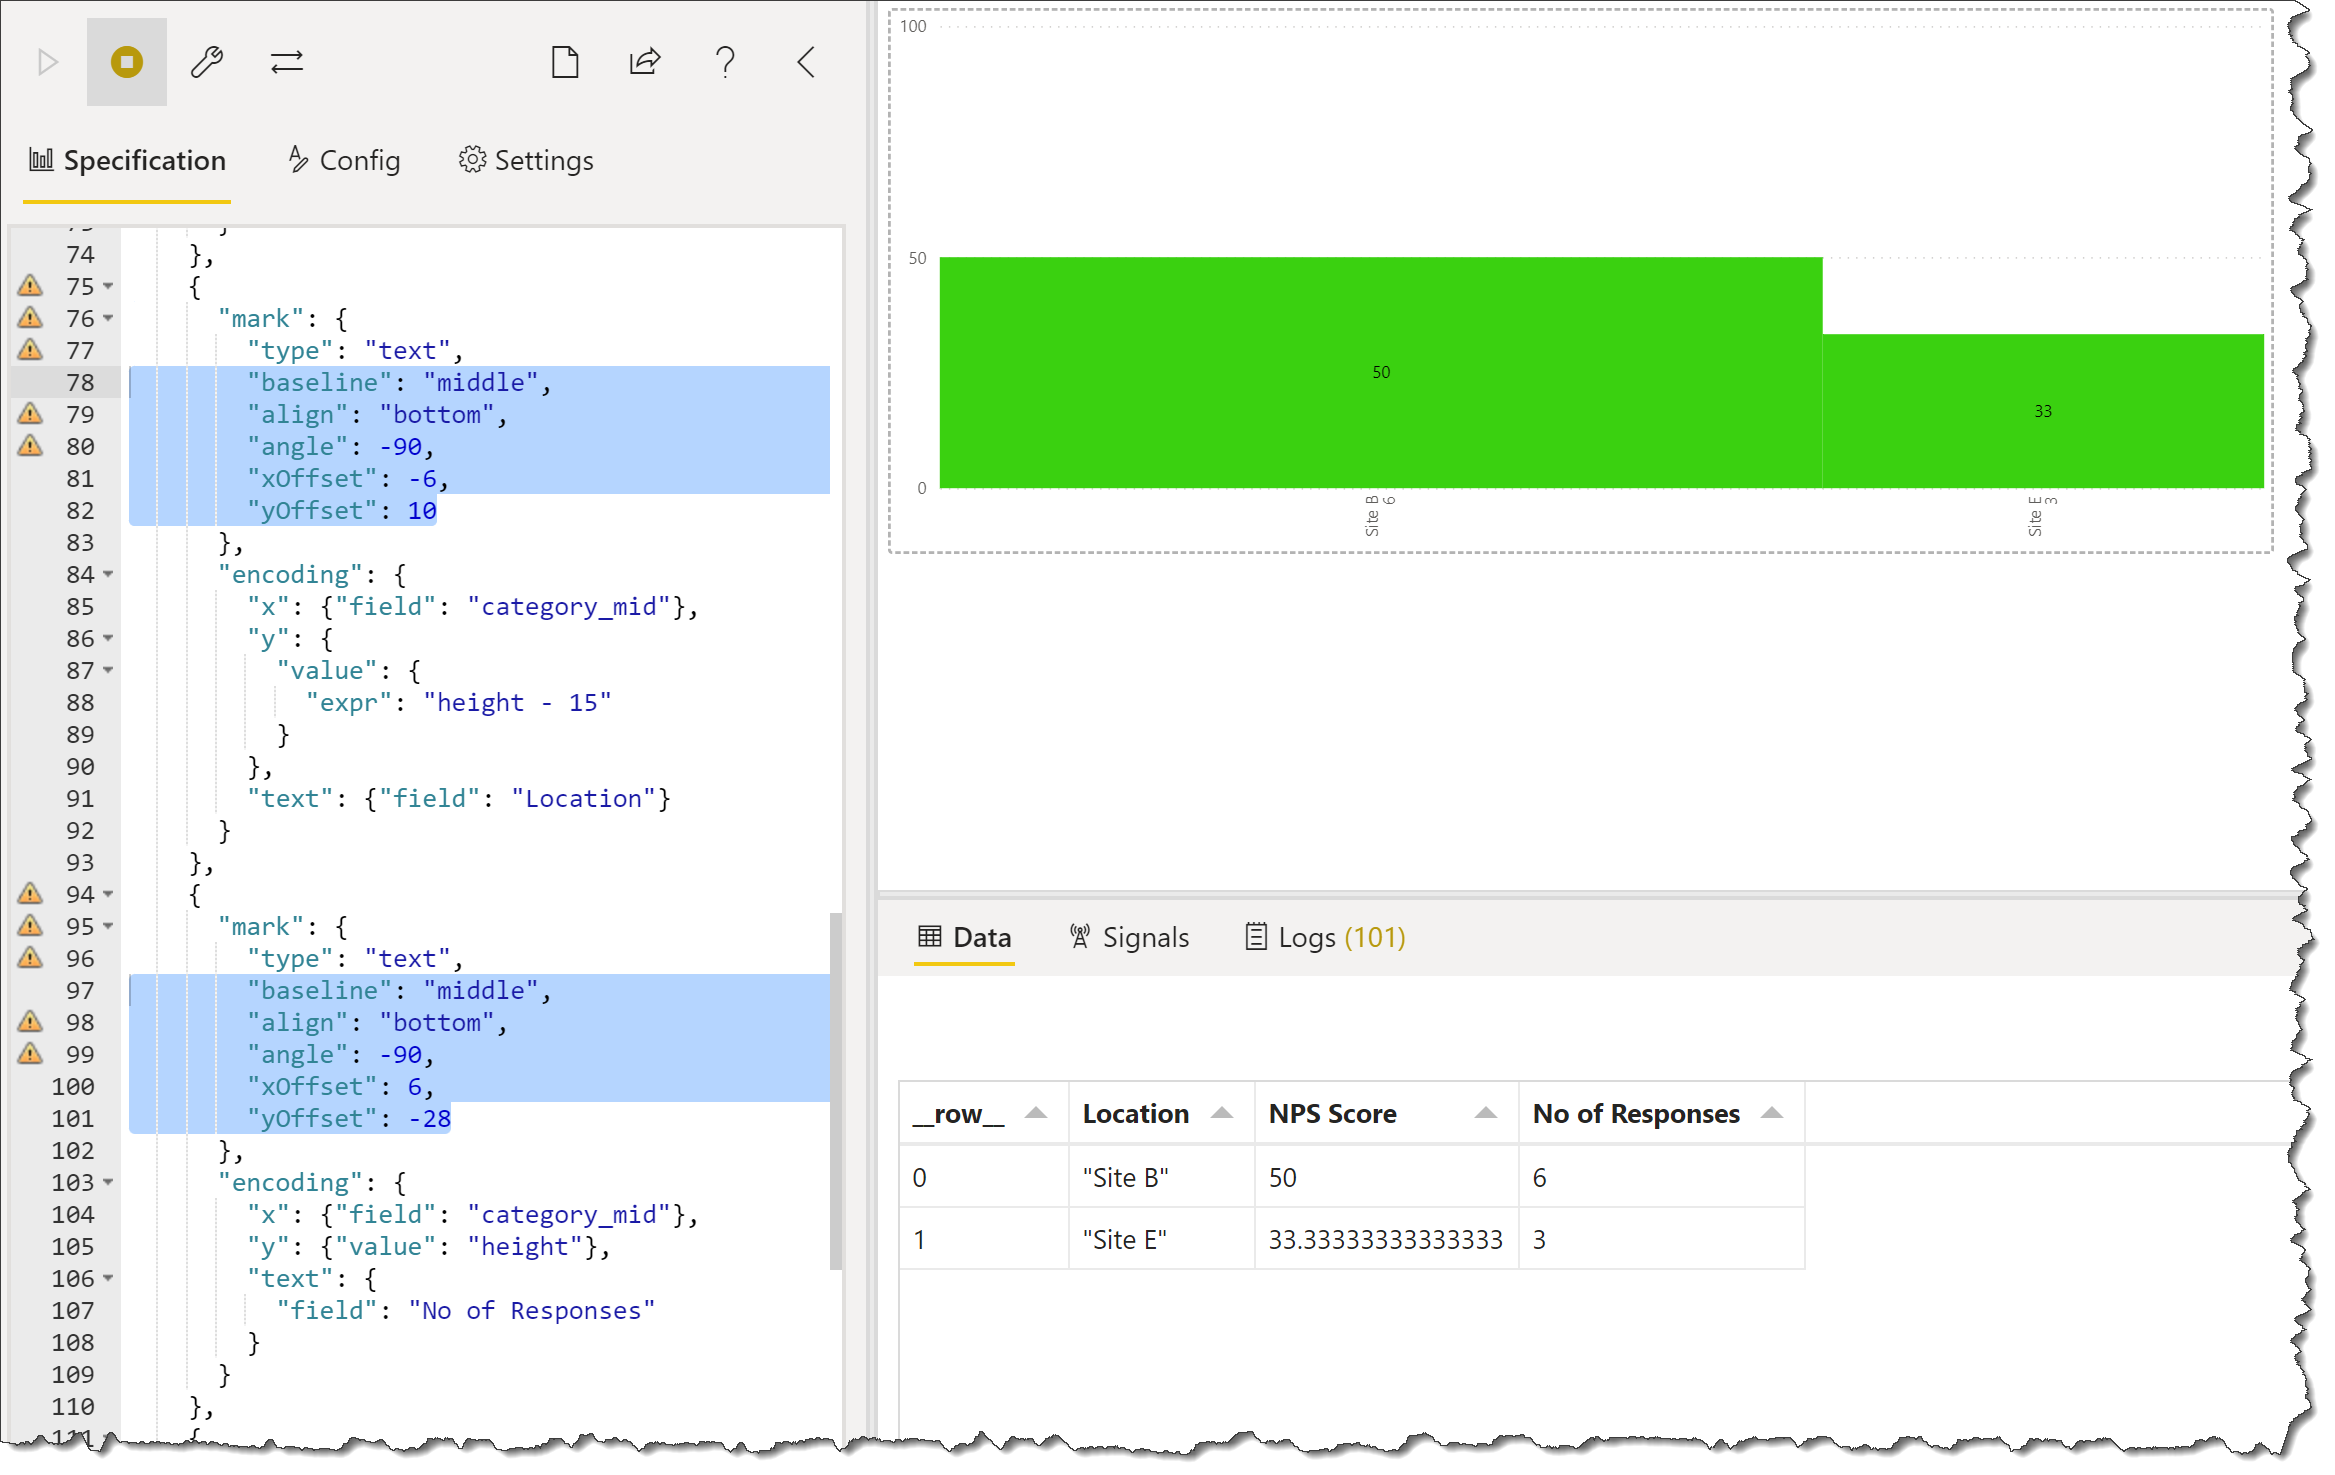
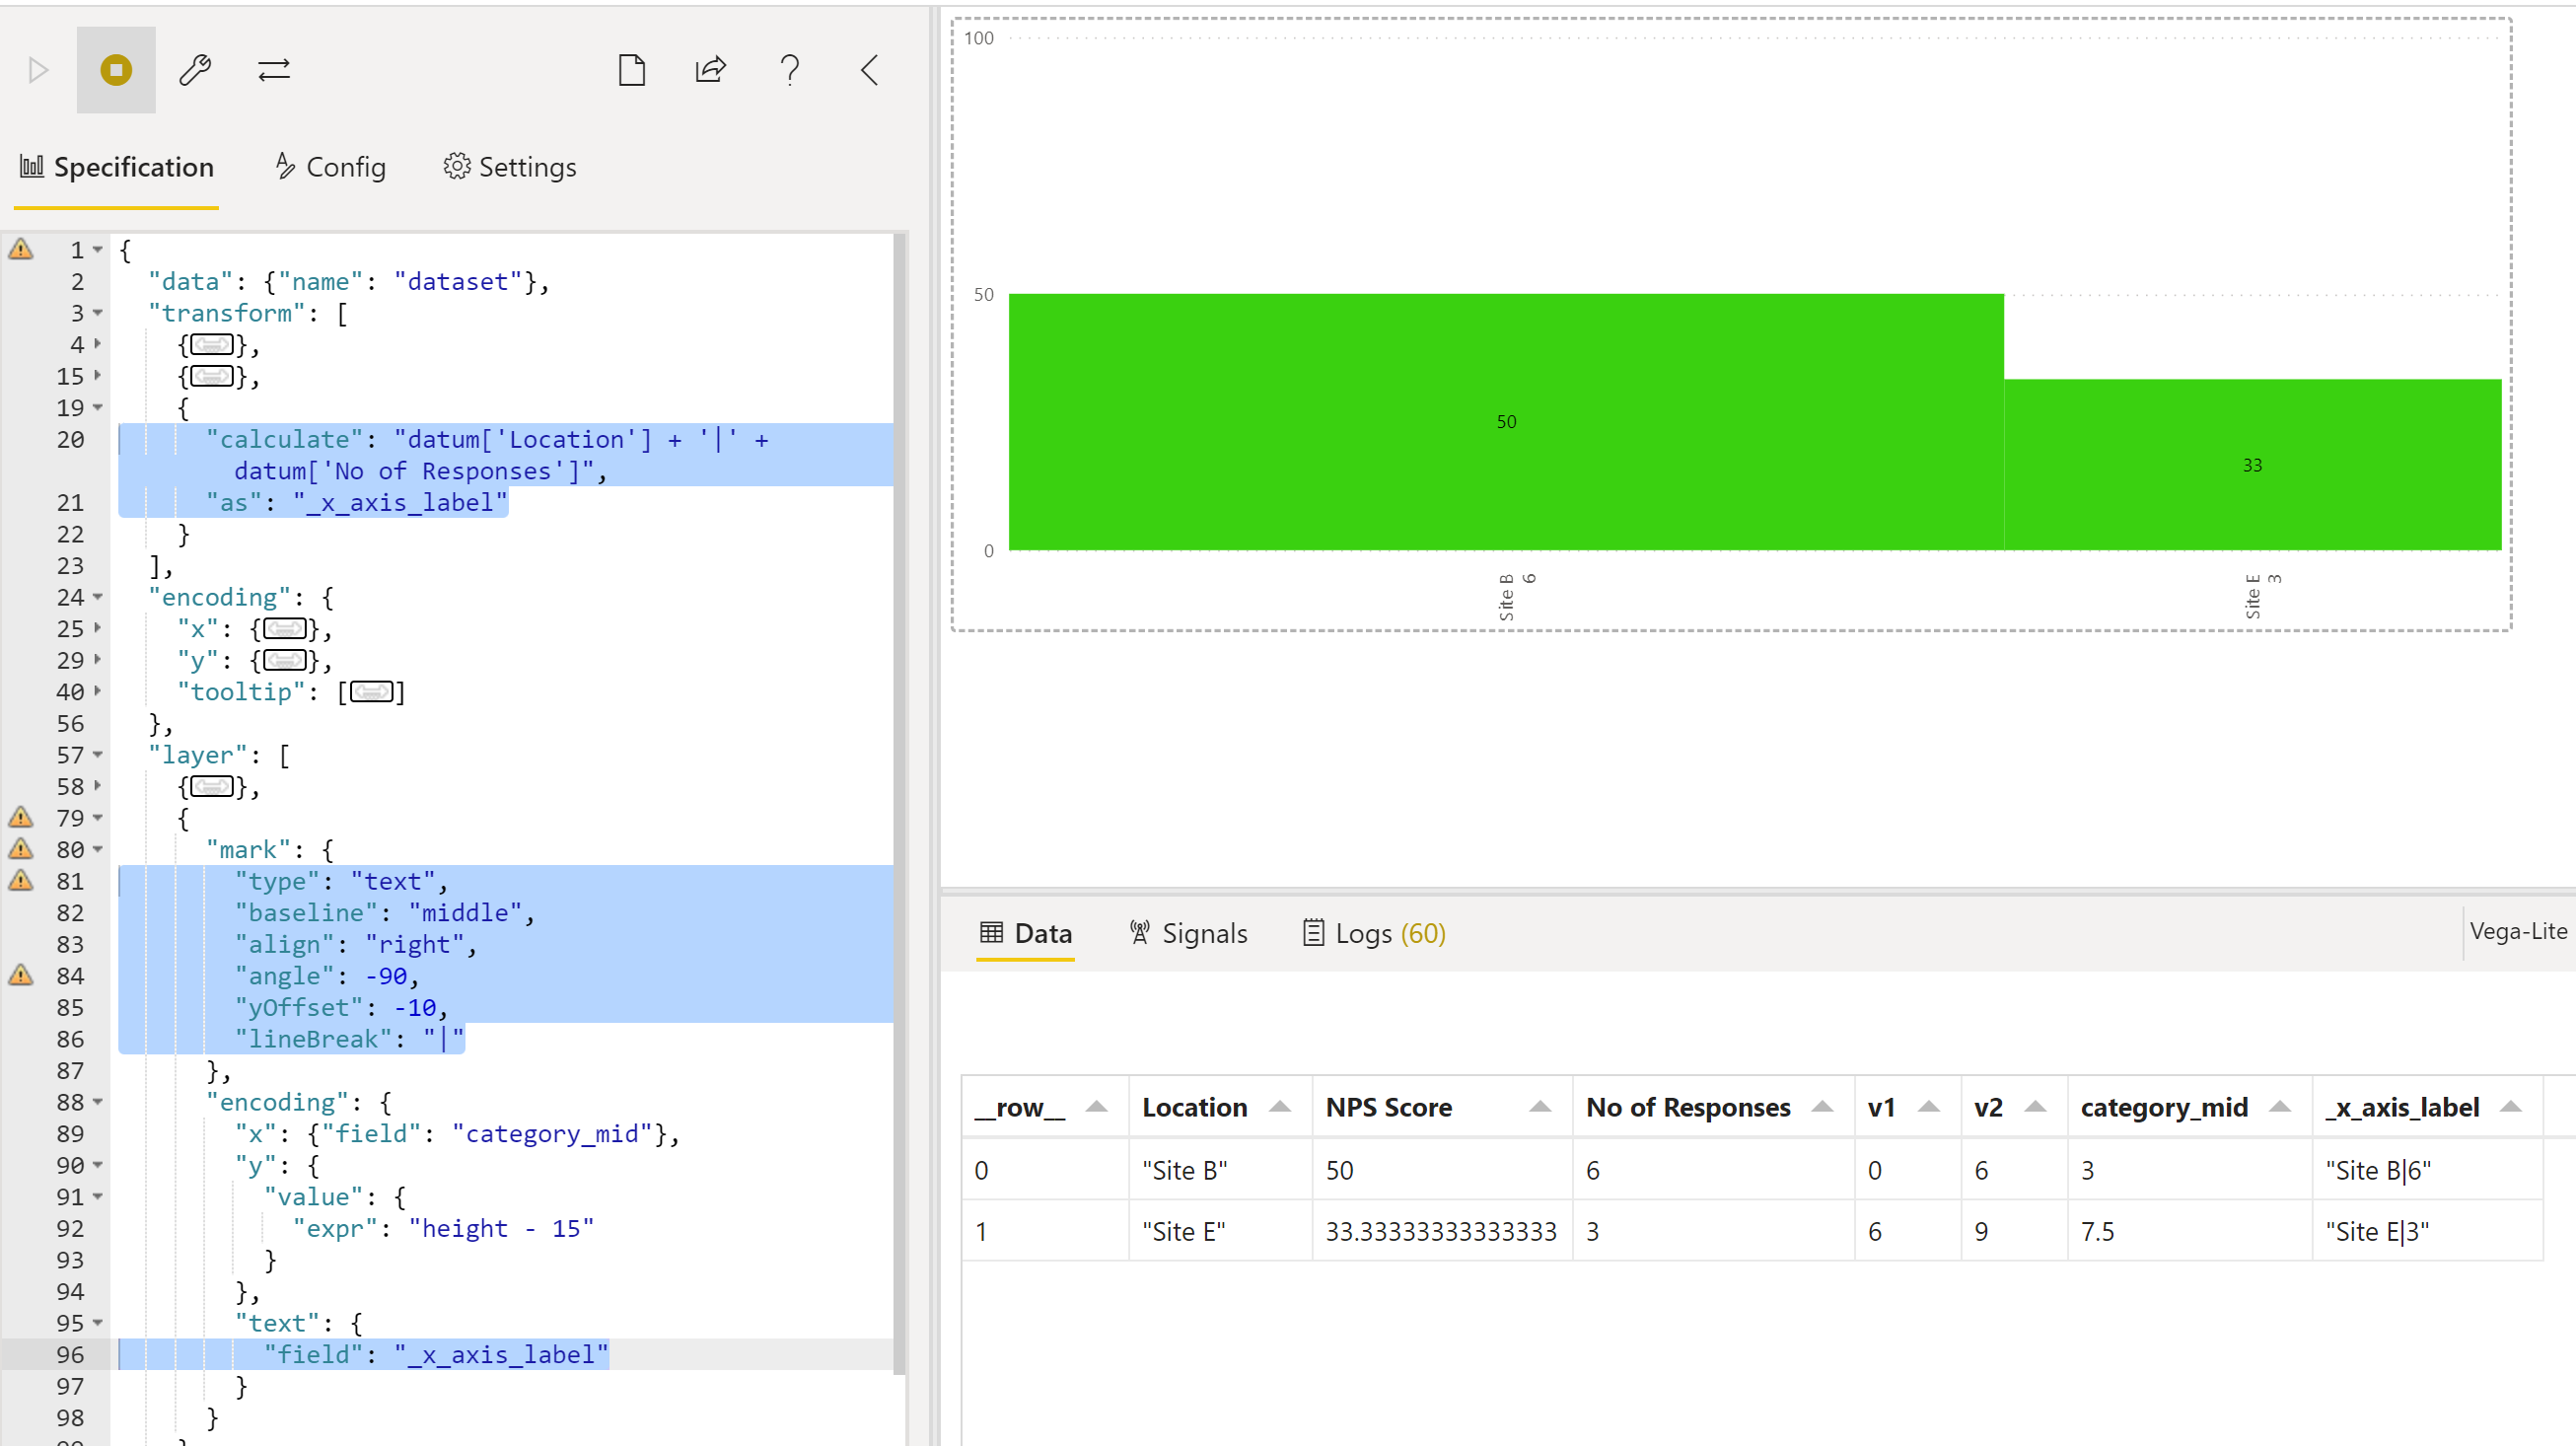
How do I amend the below code to flip the x-axis values (both the location & number) from horizontal to vertical alignment?

{
  "data": {"name": "dataset"},
  "transform": [
    {
      "stack": "No of Responses",
      "sort": [
        {
          "field": "NPS Score",
          "order": "descending"
        }
      ],
      "as": ["v1", "v2"],
      "groupby": []
    },
    {
      "calculate": "datum['v2'] - ((datum['v2'] - datum['v1']) / 2)",
      "as": "category_mid"
    }
  ],
  "encoding": {
    "x": {
      "type": "quantitative",
      "axis": null
    },
    "y": {
      "type": "quantitative",
      "axis": {"title": null},
      "scale": {
        "domain": [0, 100],
        "range": [
          {"expr": "height - 40"},
          0
        ]
      }
    },
    "tooltip": [
      {
        "field": "What is your primary location?",
        "type": "nominal"
      },
      {
        "field": "NPS Score",
        "type": "quantitative",
        "formatType": "pbiFormat",
        "format": "#"
      },
      {
        "field": "No of Responses",
        "type": "quantitative"
      }
    ]
  },
  "layer": [
    {
      "mark": {
        "type": "bar",
        "tooltip": true
      },
      "encoding": {
        "x": {"field": "v1"},
        "x2": {"field": "v2"},
        "y": {"field": "NPS Score"},
        "y2": {"datum": 0},
        "color": {
          "condition": [
            {
              "test": "datum['NPS Score'] <= 0",
              "value": "#BA3A32"
            }
          ],
          "value": "#93B558"
        }
      }
    },
    {
      "mark": {
        "type": "text",
        "baseline": "bottom"
      },
      "encoding": {
        "x": {"field": "category_mid"},
        "y": {
          "value": {
            "expr": "height - 15"
          }
        },
        "text": {
          "field": "What is your primary location?"
        }
      }
    },
    {
      "mark": {
        "type": "text",
        "baseline": "bottom"
      },
      "encoding": {
        "x": {"field": "category_mid"},
        "y": {"value": "height"},
        "text": {
          "field": "No of Responses"
        }
      }
    },
    {
      "transform": [
        {
          "calculate": "datum['NPS Score'] / 2",
          "as": "y_midpoint"
        }
      ],
      "mark": {
        "type": "text",
        "color": "black"
      },
      "encoding": {
        "text": {
          "field": "NPS Score",
          "formatType": "pbiFormat",
          "format": "#"
        },
        "x": {"field": "category_mid"},
        "y": {"field": "y_midpoint"}
      }
    }
  ]
}

Hi @DavieJoe. For an “axis” block it’s easy … just use the “labelAngle” property. It looks like you’re using text marks rather than X-axis values, but it’s hard to say without seeing the PBIX file … can you upload it showing some sample data?
Greg

1 Like

Will do, thanks Greg.

Here you go @Greg

Marimekko Test Positive Values Only.pbix (3.1 MB)

Hi @DavieJoe. You can add some more properties to each of the text marks to perhaps get something like what you’re looking for.

    "baseline": "middle",
    "align": "bottom",
    "angle": -90,
    "xOffset": -6,
    "yOffset": 10

Here’s my first try:

I think this will require too much manual adjustment to get the labels to appear just as you like, and I have another thought that might improve things, but I have commitments that prevent me from exploring further at this time. I’ll update the thread if and when I come up with something. In any event, I’ve attached my demo PBIX in case it helps.
Greg
eDNA Forum - Marimekko Chart - Positive Values.pbix (3.1 MB)

2 Likes

@Greg as always, really appreciate your time on this, I’ll take a look at what you’ve provided and have a tinker. Will mark this as solved.

Thanks again

David

1 Like

Hi @DavieJoe. Here’s a more concise version, using a single text mark and a new, combined label (with a line break character)

Here’s the JSON code:

{
  "data": {"name": "dataset"},
  "transform": [
    {
      "stack": "No of Responses",
      "sort": [
        {
          "field": "NPS Score",
          "order": "descending"
        }
      ],
      "as": ["v1", "v2"],
      "groupby": []
    },
    {
      "calculate": "datum['v2'] - ((datum['v2'] - datum['v1']) / 2)",
      "as": "category_mid"
    },
    {
      "calculate": "datum['Location'] + '|' + datum['No of Responses']",
      "as": "_x_axis_label"
    }
  ],
  "encoding": {
    "x": {
      "type": "quantitative",
      "axis": null
    },
    "y": {
      "type": "quantitative",
      "axis": {"title": null},
      "scale": {
        "domain": [0, 100],
        "range": [
          {"expr": "height - 40"},
          0
        ]
      }
    },
    "tooltip": [
      {
        "field": "Location",
        "type": "nominal"
      },
      {
        "field": "NPS Score",
        "type": "quantitative",
        "formatType": "pbiFormat",
        "format": "#"
      },
      {
        "field": "No of Responses",
        "type": "quantitative"
      }
    ]
  },
  "layer": [
    {
      "mark": {
        "type": "bar",
        "tooltip": true
      },
      "encoding": {
        "x": {"field": "v1"},
        "x2": {"field": "v2"},
        "y": {"field": "NPS Score"},
        "y2": {"datum": 0},
        "color": {
          "condition": [
            {
              "test": "datum['NPS Score'] <= 0",
              "value": "#FF4400"
            }
          ],
          "value": "#3AD110"
        }
      }
    },
    {
      "mark": {
        "type": "text",
        "baseline": "middle",
        "align": "right",
        "angle": -90,
        "yOffset": -10,
        "lineBreak": "|"
      },
      "encoding": {
        "x": {"field": "category_mid"},
        "y": {
          "value": {
            "expr": "height - 15"
          }
        },
        "text": {
          "field": "_x_axis_label"
        }
      }
    },
    {
      "transform": [
        {
          "calculate": "datum['NPS Score'] / 2",
          "as": "y_midpoint"
        }
      ],
      "mark": {
        "type": "text",
        "color": "black"
      },
      "encoding": {
        "text": {
          "field": "NPS Score",
          "formatType": "pbiFormat",
          "format": "#"
        },
        "x": {"field": "category_mid"},
        "y": {"field": "y_midpoint"}
      }
    }
  ]
}

Hope it helps.
Greg
eDNA Forum - Marimekko Chart - Positive Values - v2.pbix (3.1 MB)

1 Like

Amazing @Greg I’ll get this added in to my report today & check it out

Thanks again for your time on this, much appreciated.

Nice one Greg

1 Like