Hi Community,
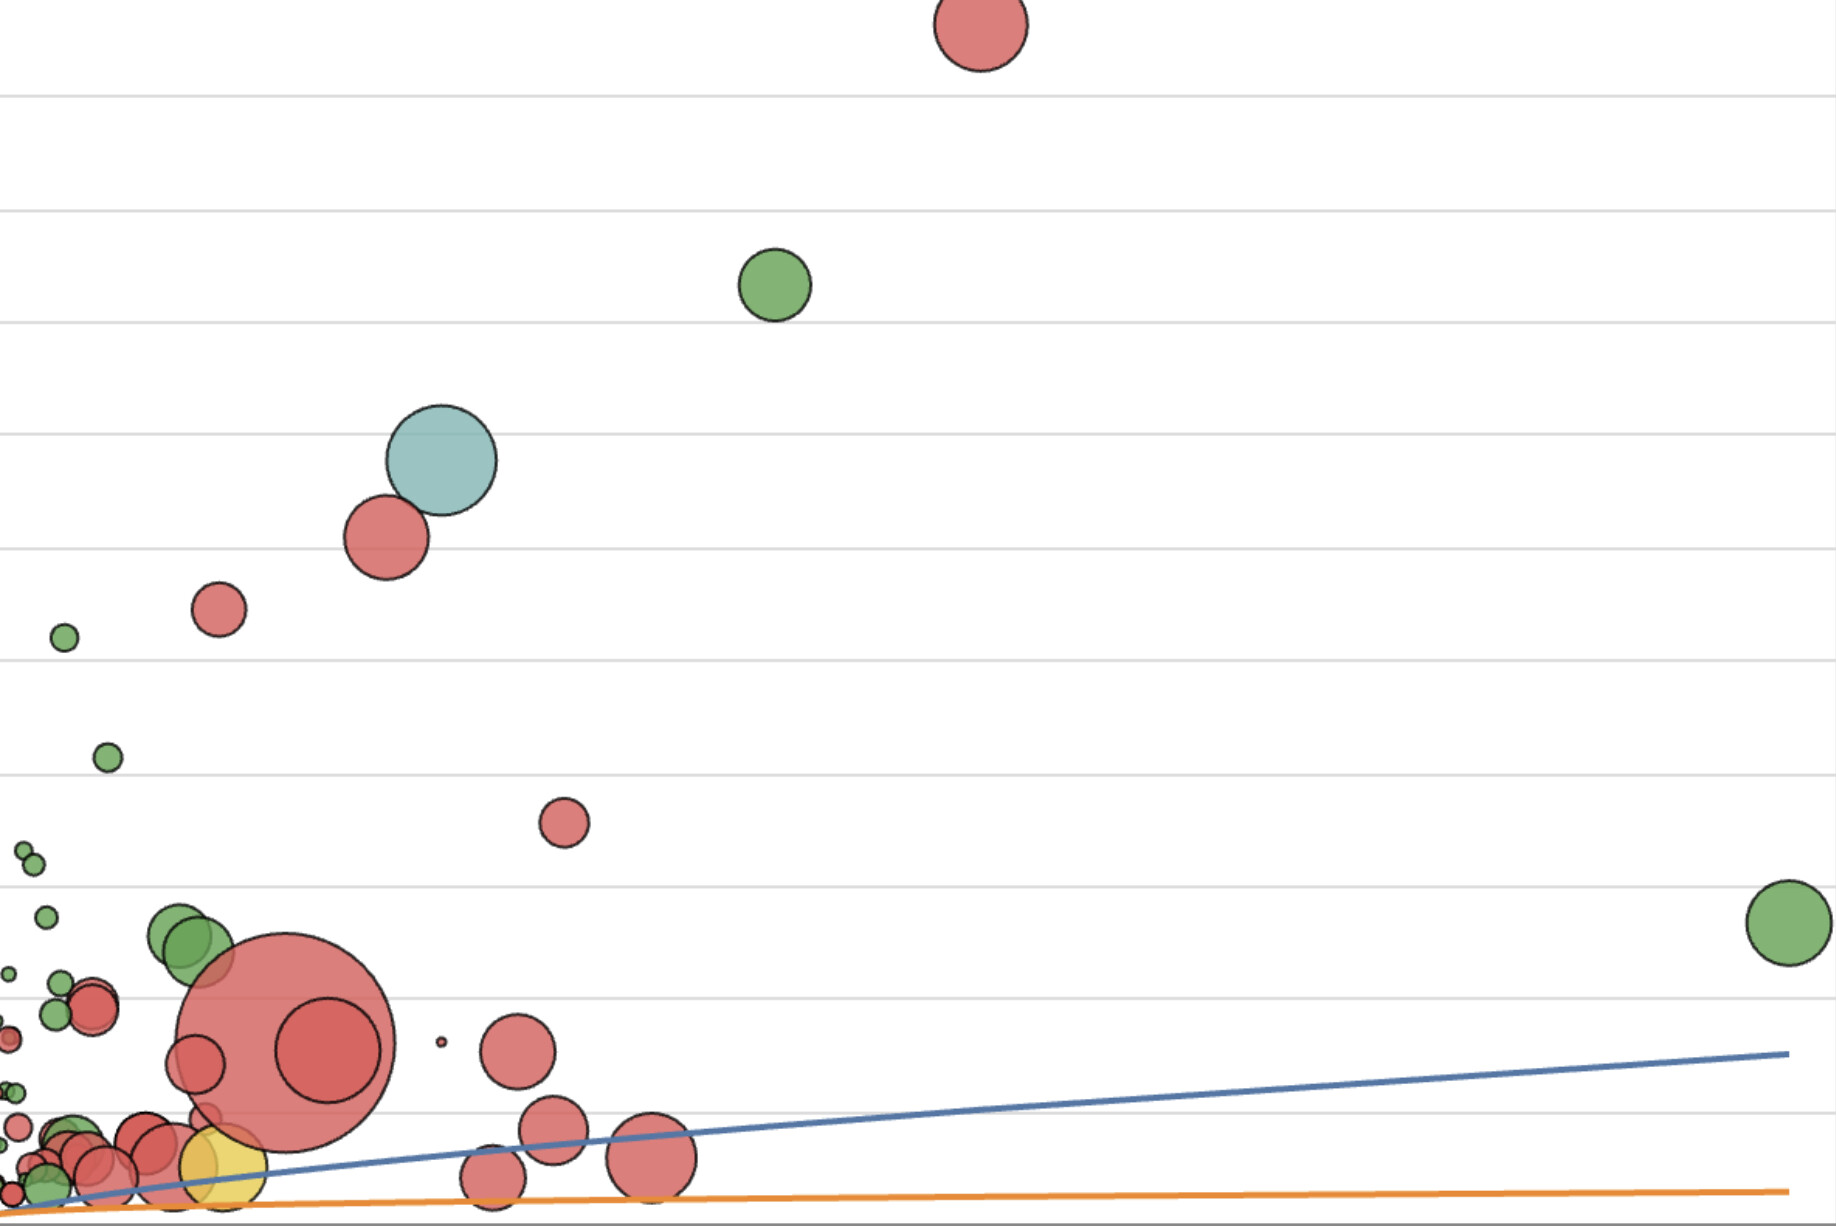
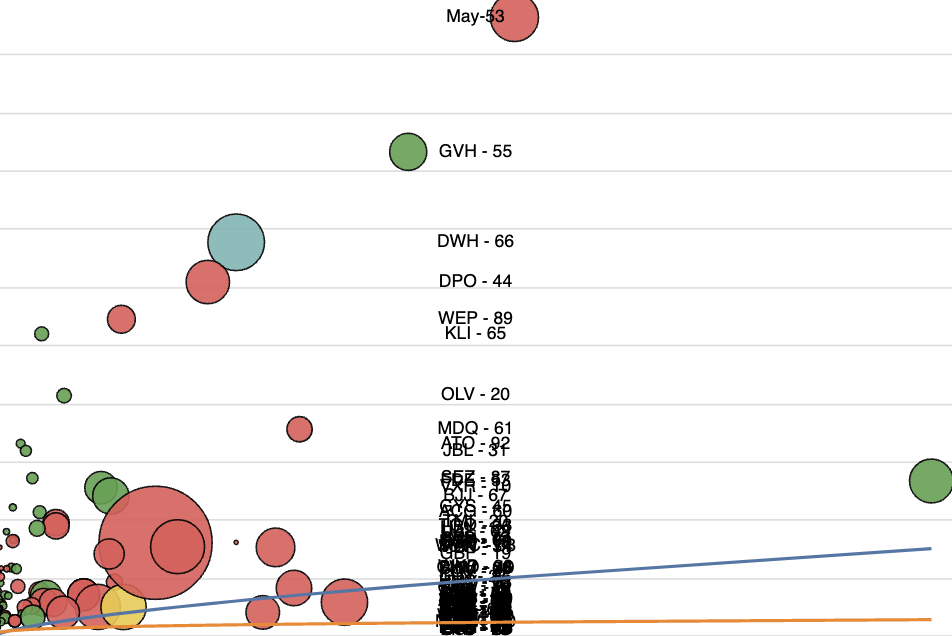
Is there a way to put a label inside circle of a bubble chart , I have this following chart. I need to put label inside this. I am uploading my script too , inside circle I want to show to value of “Label” inside circle. I am using following code `{
“$schema”: “https://vega.github.io/schema/vega-lite/v5.json”,
“data”: {
“values”: [
{
“A”: 16506,
“B”: “”,
“C”: “Estimate Line Type 1”,
“D”: 30347707.14,
“E”: null,
“Label”: “”,
“F”: null
}
]
},
“width”: 600,
“height”: 400,
“layer”: [
{
“transform”: [
{
“filter”: {
“field”: “C”,
“oneOf”: [“Amount (inflation adjusted NEW)”]
}
}
],
“mark”: {
“type”: “circle”,
“opacity”: 0.8,
“stroke”: “black”,
“strokeWidth”: 1
},
“encoding”: {
“x”: {
“field”: “A”,
“type”: “quantitative”,
“axis”: {“grid”: false}
},
“y”: {
“field”: “F”,
“type”: “quantitative”,
“axis”: {“title”: “F”}
},
“size”: {
“field”: “E”,
“type”: “quantitative”,
“title”: “E”,
“legend”: {“clipHeight”: 30},
“scale”: {“rangeMax”: 5000}
},
“color”: {“field”: “B”, “type”: “nominal”}
}
},
{
“transform”: [
{
“filter”: {
“field”: “C”,
“oneOf”: [“Estimate Line Type 1”, “Estimate Line Type 2”]
}
}
],
“mark”: {“type”: “line”},
“encoding”: {
“x”: {“field”: “A”, “type”: “quantitative”},
“y”: {“field”: “D”, “type”: “quantitative”},
“color”: {“field”: “C”, “type”: “nominal”}
}
}
],
“config”: {}
}`