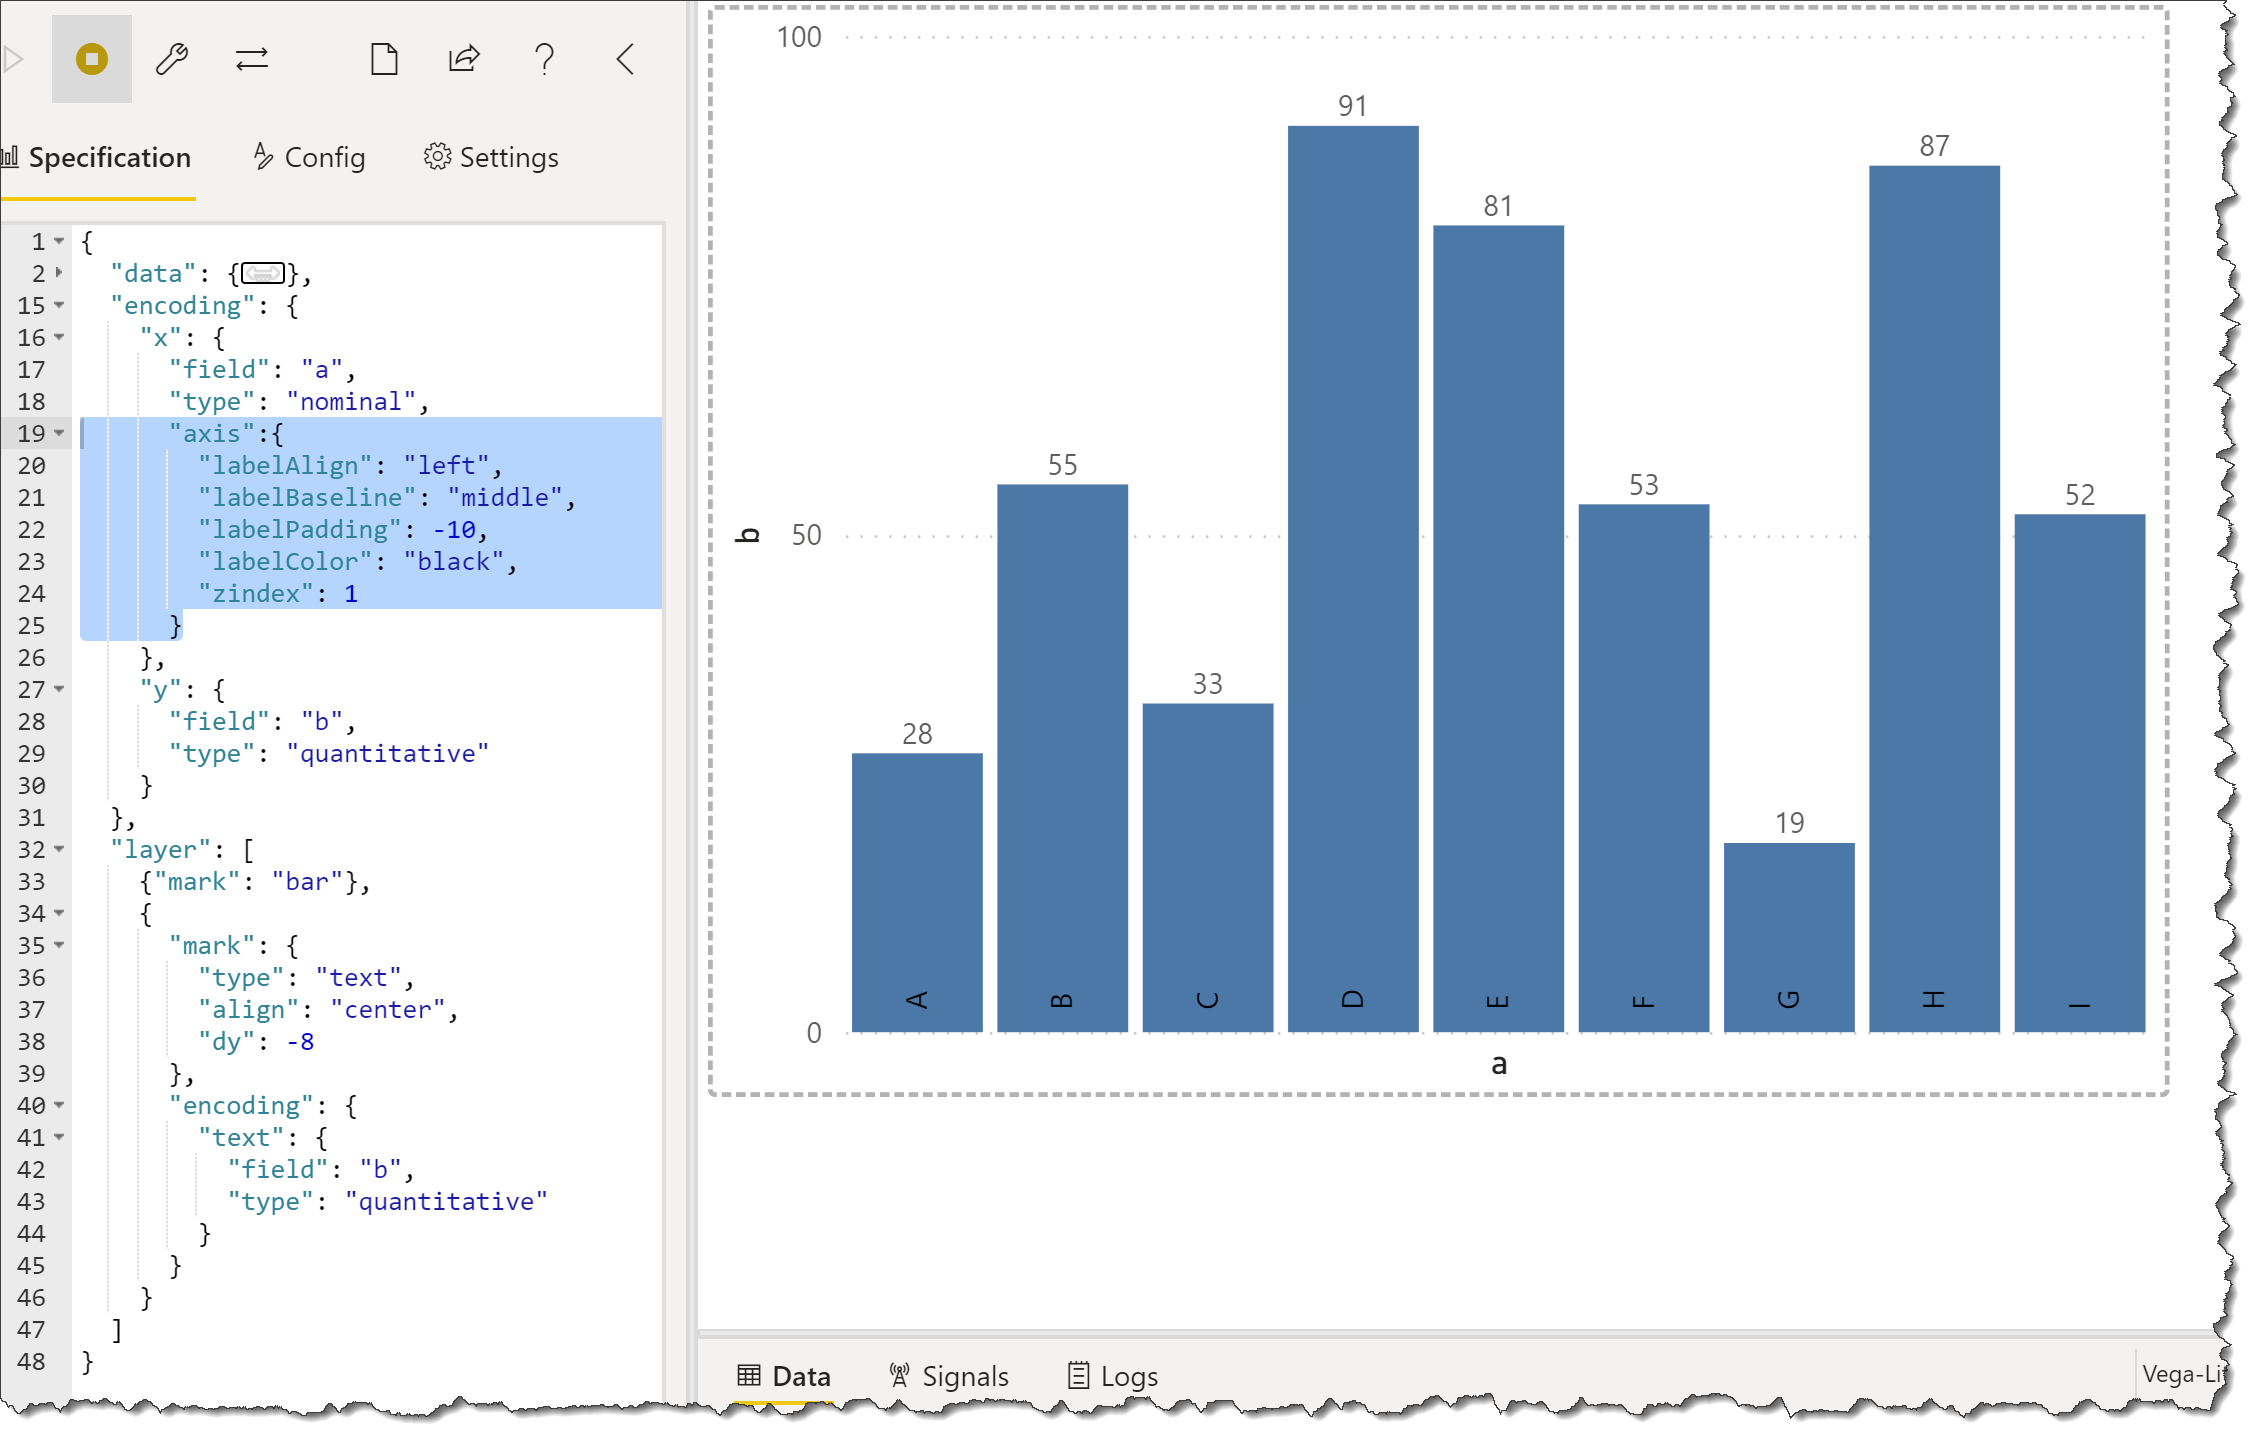
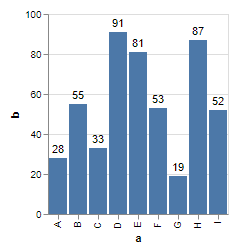
I’m trying to re-create some charts I have in an existing report using Deneb, and one of the things I’m struggling with is how to replicate the “inside base” data label positioning. Using the simple bar chart example below, how would I position the text mark inside the base of the bars?
{
  "$schema": "https://vega.github.io/schema/vega-lite/v5.json",
  "data": {
    "values": [
      {"a": "A", "b": 28},
      {"a": "B", "b": 55},
      {"a": "C", "b": 33},
      {"a": "D", "b": 91},
      {"a": "E", "b": 81},
      {"a": "F", "b": 53},
      {"a": "G", "b": 19},
      {"a": "H", "b": 87},
      {"a": "I", "b": 52}
    ]
  },
  "encoding": {
    "x": {
      "field": "a",
      "type": "nominal"
    },
    "y": {
      "field": "b",
      "type": "quantitative"
    }
  },
  "layer": [
    {
      "mark": "bar"
    },
    {
      "mark": {
        "type": "text",
        "align": "center",
        "dy": -8
      },
      "encoding": {
        "text": {
          "field": "b",
          "type": "quantitative"
        }
      }
    }
  ]
}