Deneb - How to hide future null values in line mark

In my multi layered Deneb visual, I use aggregations to plot text marks and line marks for 2 categories across months a Fin Year.

However, I would like to hide these (both the future 0 text marks and the line), much like we are able to using stock PBI images:

I’ve researched how to achieve this, and it seems I can use a test condition, but I am not sure what to assign to the datum item as described here:

  "text": {
          "condition": {
            "test": "datum.sum_Usage CY > 0",
            "type": "quantitative",
            "aggregate": "sum",
            "field": "Usage CY",
            "format": ".1f"
          },
          "value": ""

It’s the same with the Y encoding on the Current Year (black) line; in the use of an aggregation:

                "y": {
                  "aggregate": "sum",
                  "field": "Production CY",
                  "type": "quantitative",
                  "title": "Production (ton)",
                  "format": ","

How can I achieve this? Any help would be greatly appreciate!
Deneb Legend_V4.pbix (1.3 MB)

Hi @Deston. I’ve taken a quick look, and suspect that it the mixed data types in a single column (e.g., in your hard-coded data, you have [Usage CY] and [Production CY] as text [“”] in an otherwise numeric field, etc.).

My guess would be that it would also be very beneficial to shape your data as a full transactional source with discrete records in an Excel file; once imported into the Power BI model, then data shaping via Power Query may help. As it is with most Deneb visuals I’ve worked with, if you use the data shaping capabilities inside Power BI first, and then only use those in Vega-Lite as necessary. See if you can create a standard Power BI table of the records exactly as you’d like to see them before proceeding to Deneb/Vega-Lite.

With respect to your text colour question, once the data is revised, perhaps adding a “color” block to the encoding for the text labels might help, something like:

"color": {
  "condition": [
	{
	  "test": "datum['Production CY'] == 0",
	  "value": "transparent"
	}
  ],
  "value": "black"
}

If you’d like to pursue further, please create/include a data file and table; I’d be happy to then have another look.

Hope this helps.
Greg

Hi @Greg,

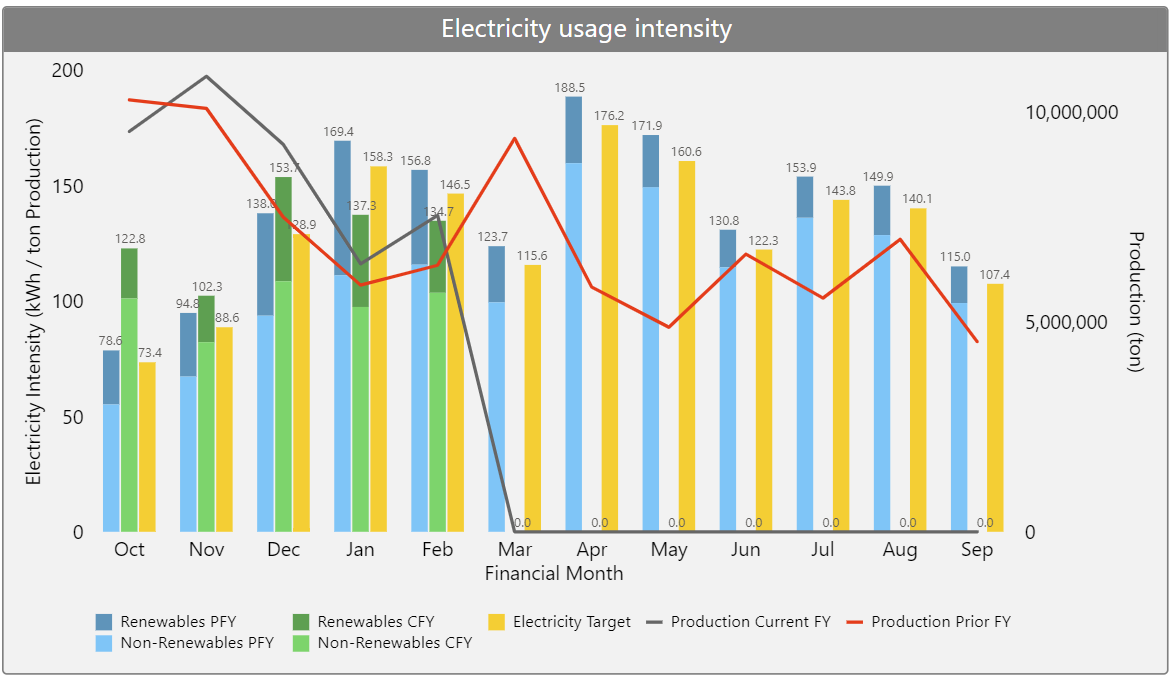
Thank you for the feedback! Small oversight on my end with regards to the mix of data types. This report is actually a masked abstraction of a solution built using proper ingestion / transformation / data modelling. I recreated the report using mock data in CSV, which I converted to JSON but the conversion stamped those text marks in the ‘future months’…

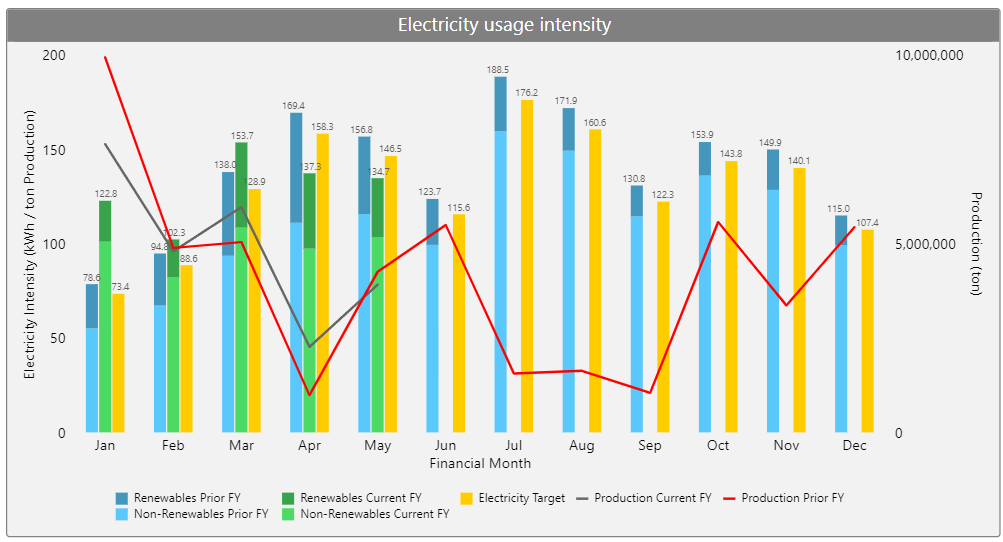
I’ve correct this in the updated pbix file.

Thank you for the suggestion; however I’ve applied this in encoding block, but am still getting the same results:

             "encoding": {
                "x": {
                  "field": "Financial Month",
                  "type": "ordinal",
                  "sort": null
                },
                "y": {
                  "aggregate": "sum",
                  "field": "Production CY",
                  "type": "quantitative",
                  "title": "Production (ton)",
                  "format": ","
                },
                "color": {
                  "condition": [
                    {
                      "test": "datum['sum_Production CY'] == 0",
                      "value": "transparent"
                    }
                  ],
                  "value": "#666666"
                }
              ,"stroke": {
                  "field": "Production CY Legend",
                  "scale": {
                    "range": ["#666666"]
                  },
                "legend": {"title": ""}
                }
              },

Please would you consider taking another look to see where I am going wrong?

Deneb Legend_V4.pbix (1.3 MB)

Hi @Deston. I still don’t see a way forward for you continuing with in-visual data.

If you could load an Excel (or CSV or whatever) file of the data to a PBIX file such that a standard Power BI table could be created, then re-work the Deneb visual to use this new data, that might help.

I have a number of commitments over the next few days, but will extract the data myself and will post to this thread anything useful that I come up with.

Greg

Hi @Greg, okay I will recreate the report using a CSV file as a data source and then re-upload. Thanks again!

Hey @Greg, here’s a revised report with the data in the pbix file.

Please let me know if this is useful.

Deneb Legend_V5.pbix (1.3 MB)

If I understand correctly, this is the output you’re after?

If so, you will need to add a filter transform to the layers that require the data filtering out. From the looks of things, you just want to keep everything whenever the value for Usage CY is not null:

"transform": [{"filter" : "datum['Usage CY'] != null"}],

From your spec, this transform would need to be added at the following points:

  • Line 165, where you have the layer for "Electricity CY Data Labels" (text mark)
  • Line 263, where you have the layer for "Production CY" (line mark)

I’ve attached a copy of your workbook with the changes, just in case my assumptions are correct.

Thx,

Daniel
Deneb Legend_V5.pbix (1.3 MB)

2 Likes

YES! Thank you @dm-p. This is exactly what I was after :slight_smile:

1 Like