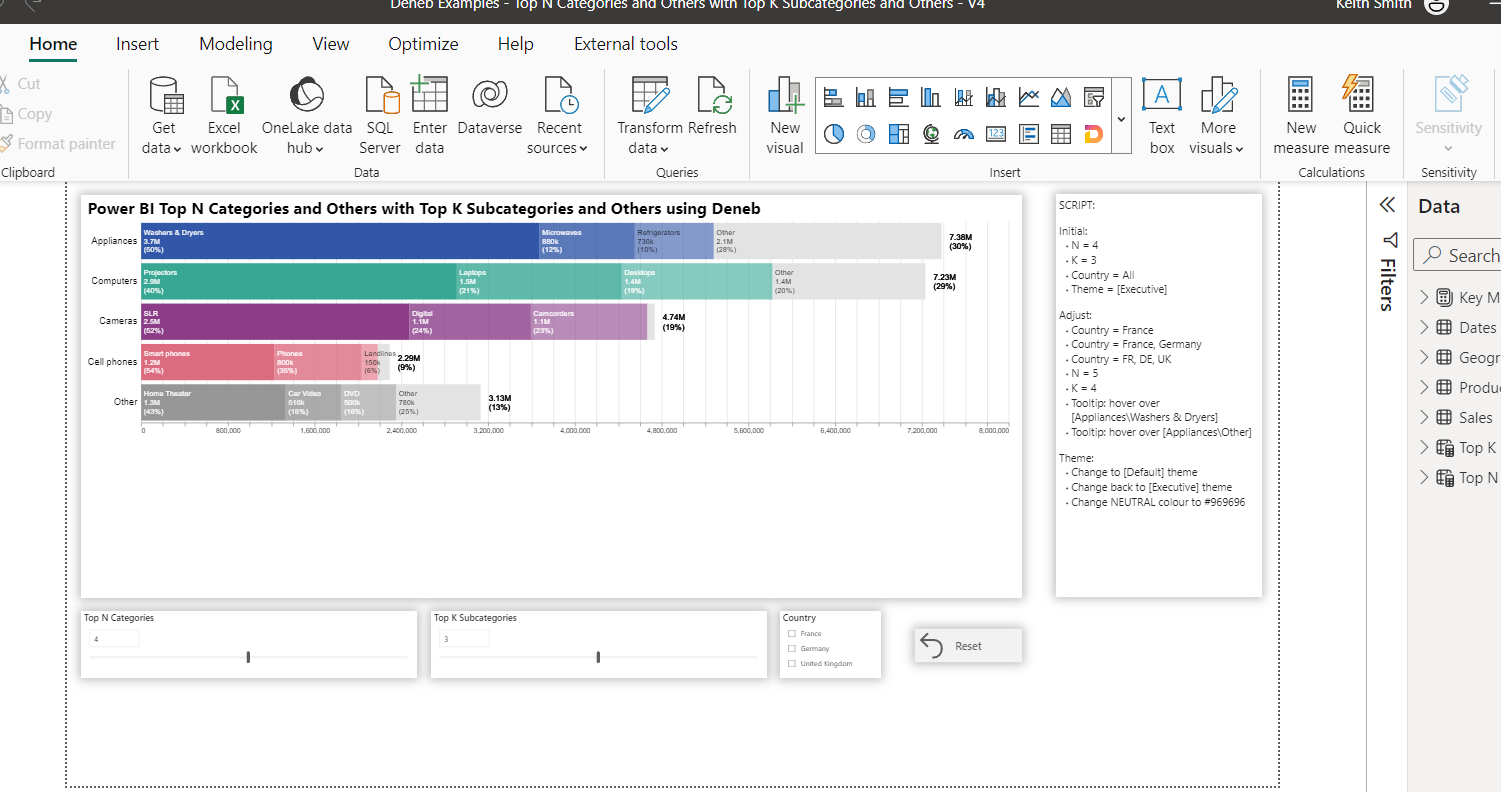
Deneb/Vega-Lite can be used transform a simple category, subcategory, and amount dataset into a bidirectional top N and others visualation. The example presented herein aggregates transactions and ranks the resulting groups; those outside the selections in the Top N Categories and Top K Subcategories selectors are placed into “Other” groups. As well, multi-line and multi-colour group labels are used, with the category groups themselves being coloured according the Power BI theme and the subcategory groups with varying transparency.
This example illustrates a number of Deneb/Vega-Lite features, including:
0 - General:
- use of a “title” block with title and subtitle
- use of a “transform” block to extend the dataset with over 20 in-visual calculations including:
- category amount (using the “joinaggregate” transform)
- category rank (using the “window” transform [with “dense_rank” operation and “sort” block])
- category name (if rank above selection then “Other”)
- reset of category rank for category = “Other” (to a big number [I used 99])
- recalculation of the category name to be a concatenation of the padded rank and the category name
- recalculation of the category amount (using the “joinaggregate” transform)
- subcategory total (using the “joinaggregate” transform)
- subcategory rank (using the “window” transform [with “dense_rank” operation and “sort” and “groupby” blocks])
- subcategory name (if rank above selection then “Other”)
- reset of subcategory rank for subcategory = “Other” (to a big number [I used 99])
- recalculation of the subcategory name to be a concatenation of the padded rank and the subcategory name
- subcategory amount (using the “aggregate” transform [with “groupby” block])
- recalculation of the category amount (using the “joinaggregate” transform [with “groupby” block])
- overall amount (using the “joinaggregate” transform)
- subcategory percent (subcategory amount/category amount)
- category percent (category amount/overall amount)
- previous subcategory amount (using the “window” transform [with “lag” operation and “groupby”, “frame”, and “sort” blocks])
- previous subcategory amount running total (using the “sum” transform [with “groupby” and “sort” blocks])
- multi-line category label
- multi-line subcategory label
- category colour using the category rank (from the Power BI theme using Deneb syntax)
- subcategory transparency (opacity) using the subcategory rank
- subcategory label colour ( <5% transparent; 5-10% or name=“Other” black; else white)
- use of a shared “encoding” block (Y=category name; X=subcategory amount) outside the “layer” block
- use of a “layer” block with stacked bar chart, subcategory label, and category label blocks
1 - Stacked Bar Chart:
- use of a “bar” mark with category colour and subcategory opacity
- use of a custom tooltip using Deneb syntax (category rank, category name, subcategory rank, subcategory name, subcategory amount, category amount, subcategory percent [of category])
2 - Subcategory Label:
- use of a “text” mark with:
- text = the multi-line subcategory label (as calculated in the “transform” section above)
- colour = the subcategory label colour (as calculated in the “transform” section above)
- X position = the previous subcategory running total amount (as calculated in the “transform” section above)
3 - Category Label:
- use of a “text” mark with:
- text = the multi-line category label (as calculated in the “transform” section above)
- X position = the category amount (as calculated in the “transform” section above)
Deneb/Vega-Lite JSON Code
{
  "title": {
    "anchor": "start",
    "align": "left",
    "orient": "top",
    "offset": 5,
    "text": "Power BI Top N Categories and Others with Top K Subcategories and Others using Deneb",
    "font": "Segoe UI",
    "fontSize": 24,
    "fontWeight": "bold",
    "fontStyle": "normal"
  },
  "data": {"name": "dataset"},
  "width": 1290,
  "height": {"step": 60},
  "transform": [
    {
      "joinaggregate": [
        {
          "op": "sum",
          "field": "Amount",
          "as": "_category_amount"
        }
      ],
      "groupby": ["Category"]
    },
    {
      "window": [
        {
          "op": "dense_rank",
          "as": "_category_rank"
        }
      ],
      "sort": [
        {
          "field": "_category_amount",
          "order": "descending"
        }
      ]
    },
    {
      "calculate": "if( datum['_category_rank'] > datum['Top N Categories Value'], 'Other', datum['Category'] )",
      "as": "Category"
    },
    {
      "calculate": "if( datum['Category'] == 'Other', 99, datum['_category_rank'] )",
      "as": "_category_rank2"
    },
    {
      "calculate": "if( slice( datum['Category'], 2, 3) != '|', pad( datum['_category_rank2'], 2, '0', 'left' ) + '|' + datum['Category'], datum['Category'] )",
      "as": "Category"
    },
    {
      "joinaggregate": [
        {
          "op": "sum",
          "field": "Amount",
          "as": "_category_amount"
        }
      ],
      "groupby": ["Category"]
    },
    {
      "joinaggregate": [
        {
          "op": "sum",
          "field": "Amount",
          "as": "_subcategory_amount"
        }
      ],
      "groupby": [
        "Category",
        "Subcategory"
      ]
    },
    {
      "window": [
        {
          "op": "dense_rank",
          "as": "_subcategory_rank"
        }
      ],
      "sort": [
        {
          "field": "_subcategory_amount",
          "order": "descending"
        }
      ],
      "groupby": ["Category"]
    },
    {
      "calculate": "if( datum['_subcategory_rank'] > datum['Top K Subcategories Value'], 'Other', datum['Subcategory'] )",
      "as": "Subcategory"
    },
    {
      "calculate": "if( datum['Subcategory'] == 'Other', 99, datum['_subcategory_rank'] )",
      "as": "_subcategory_rank2"
    },
    {
      "calculate": "if( slice( datum['Subcategory'], 2, 3) != '|', pad( datum['_subcategory_rank2'], 2, '0', 'left' ) + '|' + datum['Subcategory'], datum['Subcategory'] )",
      "as": "Subcategory"
    },
    {
      "aggregate": [
        {
          "op": "sum",
          "field": "Amount",
          "as": "_subcategory_amount"
        }
      ],
      "groupby": [
        "Category",
        "Subcategory"
      ]
    },
    {
      "joinaggregate": [
        {
          "op": "sum",
          "field": "_subcategory_amount",
          "as": "_category_amount"
        }
      ],
      "groupby": ["Category"]
    },
    {
      "joinaggregate": [
        {
          "op": "sum",
          "field": "_subcategory_amount",
          "as": "_overall_amount"
        }
      ]
    },
    {
      "calculate": "datum['_subcategory_amount'] / datum['_category_amount']",
      "as": "_subcategory_percent"
    },
    {
      "calculate": "datum['_category_amount'] / datum['_overall_amount']",
      "as": "_category_percent"
    },
    {
      "calculate": "toNumber( slice( datum['Category'], 0, 2 ) )",
      "as": "_category_rank2"
    },
    {
      "calculate": "toNumber( slice( datum['Subcategory'], 0, 2 ) )",
      "as": "_subcategory_rank2"
    },
    {
      "window": [
        {
          "op": "lag",
          "field": "_subcategory_amount",
          "as": "_previous_subcategory_amount"
        }
      ],
      "groupby": ["Category"],
      "frame": [-1, 0],
      "sort": [
        {
          "field": "_subcategory_rank2",
          "order": "ascending"
        }
      ]
    },
    {
      "window": [
        {
          "op": "sum",
          "field": "_previous_subcategory_amount",
          "as": "_previous_subcategory_running_total_amount"
        }
      ],
      "groupby": ["Category"],
      "sort": [
        {
          "field": "_subcategory_rank2",
          "order": "ascending"
        }
      ]
    },
    {
      "calculate": "slice( datum['Subcategory'], 3, 100 ) + '|' + format( datum['_subcategory_amount'], '(,.2s' ) + '|'  + '(' + format( datum['_subcategory_percent'], '.0%' ) + ')'",
      "as": "_subcategory_label"
    },
    {
      "calculate": "format( datum['_category_amount'], '(,.3s' ) + '|' + '(' + format( datum['_category_percent'], '.0%' ) + ')'",
      "as": "_category_label"
    },
    {
      "calculate": "datum['_subcategory_rank2'] == 99 ? '#E3E3E3' : datum['_category_rank2'] == 1 ? pbiColor(0) : datum['_category_rank2'] == 2 ? pbiColor(1) : datum['_category_rank2'] == 3 ? pbiColor(2) : datum['_category_rank2'] == 4 ? pbiColor(3) : datum['_category_rank2'] == 5 ? pbiColor(4) : datum['_category_rank2'] == 99 ? pbiColor('neutral') :  'firebrick'",
      "as": "_category_colour"
    },
    {
      "calculate": "datum['_subcategory_rank2'] == 99 ? 1.0 : datum['_subcategory_rank2'] == 1 ? 1.0 : datum['_subcategory_rank2'] == 2 ? 0.8 : datum['_subcategory_rank2'] == 3 ? 0.6 : datum['_subcategory_rank2'] == 4 ? 0.4 : datum['_subcategory_rank2'] == 5 ? 0.2 : 1.0",
      "as": "_subcategory_opacity"
    },
    {
      "calculate": "datum['_subcategory_percent'] < 0.05 ? 'transparent' : datum['_subcategory_percent'] < 0.10 ? 'black' : datum['_subcategory_rank2'] < 99 ? 'white' : 'black'",
      "as": "_subcategory_label_colour"
    },
    {
      "calculate": "slice( datum['Category'], 3, 100 )",
      "as": "_tooltip_category"
    },
    {
      "calculate": "slice( datum['Subcategory'], 3, 100 )",
      "as": "_tooltip_subcategory"
    }
  ],
  "encoding": {
    "y": {
      "field": "Category",
      "type": "nominal",
      "axis": {
        "title": null,
        "offset": 4,
        "domain": false,
        "ticks": false,
        "labelFontSize": 14,
        "labelExpr": "slice( datum.value, 3, 100 )"
      }
    },
    "x": {
      "field": "_subcategory_amount",
      "type": "quantitative",
      "sort": {
        "op": "sum",
        "field": "_subcategory_rank2",
        "order": "ascending"
      },
      "axis": {"title": null}
    }
  },
  "layer": [
    {
      "name": "STACKED_BAR_CHART",
      "mark": {
        "type": "bar",
        "tooltip": true,
        "fill": {
          "expr": "datum['_category_colour']"
        },
        "fillOpacity": {
          "expr": "datum['_subcategory_opacity']"
        }
      },
      "encoding": {
        "color": {
          "field": "Subcategory",
          "legend": null
        },
        "tooltip": [
          {
            "field": "_category_rank2",
            "type": "quantitative",
            "title": "Category Rank"
          },
          {
            "field": "_tooltip_category",
            "type": "nominal",
            "title": "Category"
          },
          {
            "field": "_subcategory_rank2",
            "type": "quantitative",
            "title": "Subcategory Rank"
          },
          {
            "field": "_tooltip_subcategory",
            "type": "nominal",
            "title": "Subcategory"
          },
          {
            "field": "_subcategory_amount",
            "type": "quantitative",
            "formatType": "pbiFormat",
            "format": "$#,00",
            "title": "Subcategory Amount"
          },
          {
            "field": "_category_amount",
            "type": "quantitative",
            "formatType": "pbiFormat",
            "format": "$#,00",
            "title": "Category Amount"
          },
          {
            "field": "_subcategory_percent",
            "type": "quantitative",
            "formatType": "pbiFormat",
            "format": "0.0%",
            "title": "Subcategory %"
          }
        ]
      }
    },
    {
      "name": "SUBCATEGORY_LABEL",
      "mark": {
        "type": "text",
        "align": "left",
        "baseline": "middle",
        "xOffset": 4,
        "yOffset": -12,
        "color": {
          "expr": "datum['_subcategory_label_colour']"
        }
      },
      "encoding": {
        "text": {
          "field": "_subcategory_label"
        },
        "x": {
          "field": "_previous_subcategory_running_total_amount",
          "type": "quantitative"
        }
      }
    },
    {
      "name": "CATEGORY_LABEL",
      "mark": {
        "type": "text",
        "align": "left",
        "fontSize": 12,
        "xOffset": 12,
        "yOffset": -6
      },
      "encoding": {
        "text": {
          "field": "_category_label"
        },
        "x": {
          "field": "_category_amount",
          "type": "quantitative"
        }
      }
    }
  ]
}
The intent of this example is not to provide a finished visual, but rather to serve as a starting point for further custom visual development.
Also included is the development sample PBIX using data from the Microsoft Contoso sample SQL database (filtered to the European continent and top 100,000 rows, and with all dates being moved forwards by 10 years). Solely to improve the presentation, several product category and subcategory names were shortened. (Of course, while the category and subcategory names and amounts remain fictional, they are out-of-date as they reflect the global environment of 2007-2009.)
This example is provided as-is for information purposes only, and its use is solely at the discretion of the end user; no responsibility is assumed by the author.
Greg
Deneb Examples - Top N Categories and Others with Top K Subcategories and Others - V4.pbix (1.8 MB)