Deneb/Vega-Lite can be used to create both Venn Diagrams and Bar Charts that not only visually represent the unique and common elements between sets (most often 2 or 3), but also the relative set sizes. While Venn Diagrams often use set circles of the same size to clearly and easily show the interactions between sets, they can misrepresent the relative sizes of the sets and interactions.
When the analysis involves more than 3 sets, an UpSet Plot may be more beneficial; an example of an UpSet Plot using Deneb/Vega-Lite can be found here:
The example presented herein includes both a standard Venn Diagram and a Bar Chart for both 2-and-3 set comparisons. Showing both same size and relative size layouts may help visualize set and interaction insights.
While the Deneb/Vega-Lite code for both the 2-Set and 3-Set versions is mostly similar, there are a few differences. The 2-Set version is described here, and illustrates a number of Deneb/Vega-Lite features, including:
0 - General:
- a “title” block for the composite visual
- a shared “transform” block to extend the dataset in-visual with:
- a “filter” transform using a “field comparison to an array” condition to limit the data to P1 & P2 sets, and the interaction between P1 & P2
- a “joinaggregate” transform to add the sum of the 2 sets to all rows
- a “calculate” transform to determine the percent of set-total
- a “params” block with:
- a “name” parameter to set the leader line colours
- a “hconcat” block to horizontally concatenate the venn diagram, a separator, and the bar charts
1 - Venn Diagram:
- a nested “title” block
- a nested “layer” block with:
- a “filter” transform to restrict the dataset to the single record of interest
- 2x “arc” mark for the sets with:
- hard-coded values for the start and end angles (0,2*PI) [to show a full circle]
- hard-coded values for the inner and outer radius (0,100)
- hard-coded values for the X and Y coordinates (first 0,100; second 150,100)
- hard-coded values for the set colours (first red; second blue) with 50% opacity (so the interaction area is shown automatically
- an “encoding\tooltip” block to show interaction, product, sales amount, and sales percent (of total set sales)
- 1x “arc” mark for the interaction with:
- hard-coded values for the start and end angles (0,2*PI) [to show a full circle]
- hard-coded values for the inner and outer radius (0,26)
- hard-coded values for the X and Y coordinates (75,100)
- hard-coded values for the interaction colour (transparent)
- an “encoding\tooltip” block to show interaction, product, sales amount, and sales percent (of total set sales)
- 3x “text” marks for the set and interaction labels with:
- a “filter” transform to restrict the dataset to the single record of interest
- a “calculate” transform to compose the multi-line label array (id, product, sales amount)
- hard-coded values for the X and Y coordinates
- 3x “rule” marks for the leader lines for the set\interaction labels with:
- colour set using the leader line colour parameter
- hard-coded values for the X, X2, Y, and Y2 coordinates
NOTE: there are 3 options for creating a circle: a “circle” mark, a “point\circle” mark, and an “arc” mark. The use of the “arc” mark is legacy as the initial draft versions attempted to represent the set sizes visually and the radius was more easily calculated; while the set circles were easily placed and sized, the relative interaction placement and sizing proved more difficult, and simple filtered bar charts were deemed to better convey the relative sizes.
2 - Separator:
- a “filter” transform to restrict the dataset to a single record
- a “rule” mark with Y and Y2 values only (so, vertical)
3 - Bar Chart:
- a nested “title” block
- a nested, shared “encoding” block to ensure consistent axes are used for all layer elements
- a nested “layer” block with:
- a “bar” mark for the background (light grey; 100% width)
- a “bar” mark for the foreground (set=sky blue; interaction=dark grey; sales percent [of total set sales]) with custom tooltip
Deneb/Vega-Lite JSON Code:
{
"title": {
"anchor": "start",
"align": "left",
"offset": 20,
"text": "Power BI Venn Diagram & Bar Chart using Deneb - 2-Set",
"font": "Verdana",
"fontSize": 24,
"fontWeight": "bold",
"fontStyle": "normal"
},
"data": {"name": "dataset"},
"width": 1000,
"height": 100,
"transform": [
{
"filter": {
"field": "Interaction",
"oneOf": ["P1", "P2", "P1uP2"]
}
},
{
"calculate": "datum['Interaction ID'] <= 3 ? datum['Sales'] : 0",
"as": "_total_sales_of_sets_only"
},
{
"joinaggregate": [
{
"op": "sum",
"field": "_total_sales_of_sets_only",
"as": "_total_sales"
}
]
},
{
"calculate": "datum['Sales'] / datum['_total_sales']",
"as": "_sales_percent_of_total_sales_of_sets_only"
}
],
"params": [
{
"name": "_leader_line_colour",
"value": "black"
}
],
"hconcat": [
{
"name": "VENN_DIAGRAM",
"title": {
"anchor": "middle",
"align": "center",
"offset": 0,
"text": "Venn Diagram",
"font": "Verdana",
"fontSize": 16,
"fontWeight": "normal",
"fontStyle": "italic"
},
"height": 300,
"width": 160,
"layer": [
{
"name": "VENN_PRODUCT_1",
"transform": [
{
"filter": "datum['Interaction ID'] == 1"
}
],
"mark": {
"type": "arc",
"tooltip": true,
"theta": 0,
"theta2": {
"expr": "2 * PI"
},
"innerRadius": 0,
"outerRadius": 100,
"color": "red",
"stroke": "black",
"opacity": 0.5,
"x": 0,
"y": 100
},
"encoding": {
"tooltip": [
{
"field": "Interaction",
"type": "nominal"
},
{
"field": "Interaction Product",
"type": "nominal"
},
{
"field": "Sales",
"type": "quantitative"
},
{
"field": "_sales_percent_of_total_sales_of_sets_only",
"type": "quantitative",
"title": "% of Total Sales",
"format": ".0%"
}
]
}
},
{
"name": "VENN_PRODUCT_2",
"transform": [
{
"filter": "datum['Interaction ID'] == 2"
}
],
"mark": {
"type": "arc",
"tooltip": true,
"theta": 0,
"theta2": {
"expr": "2 * PI"
},
"innerRadius": 0,
"outerRadius": 100,
"color": "blue",
"stroke": "black",
"opacity": 0.5,
"x": 150,
"y": 100
},
"encoding": {
"tooltip": [
{
"field": "Interaction",
"type": "nominal"
},
{
"field": "Interaction Product",
"type": "nominal"
},
{
"field": "Sales",
"type": "quantitative"
},
{
"field": "_sales_percent_of_total_sales_of_sets_only",
"type": "quantitative",
"title": "% of Total Sales",
"format": ".0%"
}
]
}
},
{
"name": "VENN_INTERACTION_1",
"transform": [
{
"filter": "datum['Interaction ID'] == 4"
}
],
"mark": {
"type": "arc",
"tooltip": true,
"theta": 0,
"theta2": {
"expr": "2 * PI"
},
"innerRadius": 0,
"outerRadius": 26,
"color": "transparent",
"opacity": 0.5,
"x": 75,
"y": 100
},
"encoding": {
"tooltip": [
{
"field": "Interaction",
"type": "nominal"
},
{
"field": "Interaction Product",
"type": "nominal"
},
{
"field": "Sales",
"type": "quantitative"
},
{
"field": "_sales_percent_of_total_sales_of_sets_only",
"type": "quantitative",
"title": "% of Total Sales",
"format": ".0%"
}
]
}
},
{
"name": "VENN_LABEL_1",
"transform": [
{
"filter": "datum['Interaction ID'] == 1"
},
{
"calculate": "[ datum['Interaction'], datum['Interaction Product'], format( datum['Sales'], ',.0f' ) ]",
"as": "_data_label"
}
],
"mark": {
"type": "text",
"align": "right",
"fontSize": 16,
"fontStyle": "italic",
"color": "black",
"x": -100,
"y": 0
},
"encoding": {
"text": {
"field": "_data_label",
"type": "nominal"
}
}
},
{
"name": "VENN_LABEL_2",
"transform": [
{
"filter": "datum['Interaction ID'] == 2"
},
{
"calculate": "[ datum['Interaction'], datum['Interaction Product'], format( datum['Sales'], ',.0f' ) ]",
"as": "_data_label"
}
],
"mark": {
"type": "text",
"align": "left",
"fontSize": 16,
"fontStyle": "italic",
"color": "black",
"x": 250,
"y": 0
},
"encoding": {
"text": {
"field": "_data_label",
"type": "nominal"
}
}
},
{
"name": "VENN_LABEL_4",
"transform": [
{
"filter": "datum['Interaction ID'] == 4"
},
{
"calculate": "[ datum['Interaction'], datum['Interaction Product'], format( datum['Sales'], ',.0f' ) ]",
"as": "_data_label"
}
],
"mark": {
"type": "text",
"align": "left",
"fontSize": 16,
"fontStyle": "italic",
"color": "black",
"x": 175,
"y": 220
},
"encoding": {
"text": {
"field": "_data_label",
"type": "nominal"
}
}
},
{
"name": "VENN_LEADER_LINE_1",
"mark": {
"type": "rule",
"color": {
"expr": "_leader_line_colour"
}
},
"encoding": {
"x": {
"datum": -60,
"type": "quantitative",
"scale": {
"domain": [0, 100]
},
"axis": null
},
"y": {
"datum": 100,
"type": "quantitative",
"scale": {
"domain": [0, 100]
},
"axis": null
},
"x2": {"datum": 0},
"y2": {"datum": 65}
}
},
{
"name": "VENN_LEADER_LINE_2",
"mark": {
"type": "rule",
"color": {
"expr": "_leader_line_colour"
}
},
"encoding": {
"x": {
"datum": 150,
"type": "quantitative",
"scale": {
"domain": [0, 100]
}
},
"y": {
"datum": 100,
"type": "quantitative",
"scale": {
"domain": [0, 100]
}
},
"x2": {"datum": 100},
"y2": {"datum": 65}
}
},
{
"name": "VENN_LEADER_LINE_3",
"mark": {
"type": "rule",
"color": {
"expr": "_leader_line_colour"
}
},
"encoding": {
"x": {
"datum": 105,
"type": "quantitative",
"scale": {
"domain": [0, 100]
}
},
"y": {
"datum": 28,
"type": "quantitative",
"scale": {
"domain": [0, 100]
}
},
"x2": {"datum": 50},
"y2": {"datum": 65}
}
}
]
},
{
"name": "SEPARATOR",
"width": 20,
"height": 1000,
"transform": [
{
"filter": "datum['__row__'] == 0"
}
],
"mark": {
"type": "rule",
"color": "#C9C9C9",
"strokeWidth": 4,
"strokeCap": "round",
"y": -20,
"y2": 280
},
"encoding": {
"x": {"datum": 0, "axis": null}
}
},
{
"name": "BAR_CHART",
"title": {
"anchor": "middle",
"align": "left",
"offset": 10,
"text": "Bar Chart",
"font": "Verdana",
"fontSize": 16,
"fontWeight": "normal",
"fontStyle": "italic"
},
"width": 560,
"height": 260,
"encoding": {
"x": {
"type": "quantitative",
"axis": {
"format": ".0%",
"domain": false,
"ticks": false,
"labelFlush": false,
"labelOffset": 10,
"title": null
}
},
"y": {
"type": "nominal",
"sort": {
"op": "max",
"field": "Interaction ID",
"order": "ascending"
},
"axis": {
"title": null,
"ticks": false,
"domain": false,
"labelFontSize": 16,
"labelFontStyle": "italic",
"labelColor": "black",
"labelPadding": 4,
"labelBaseline": "bottom",
"labelExpr": "split( datum.label, '&' )"
}
}
},
"layer": [
{
"name": "BACKGROUND_BAR_SETS",
"transform": [
{
"calculate": "1",
"as": "_x"
}
],
"mark": {
"type": "bar",
"color": "#969696",
"opacity": 0.1,
"cornerRadius": 10
},
"encoding": {
"x": {"field": "_x"},
"y": {
"field": "Interaction Product"
}
}
},
{
"name": "FOREGROUND_BAR_SETS",
"transform": [
{
"calculate": "1*999",
"as": "_test_only_delete_me"
}
],
"mark": {
"type": "bar",
"cornerRadius": 10,
"tooltip": true
},
"encoding": {
"x": {
"field": "_sales_percent_of_total_sales_of_sets_only"
},
"y": {
"field": "Interaction Product"
},
"color": {
"field": "Type",
"type": "nominal",
"scale": {
"domain": [
"Set",
"Interaction"
],
"range": [
"skyblue",
"#C9C9C9"
]
},
"legend": {
"orient": "bottom",
"symbolType": "circle",
"symbolSize": 300,
"labelFontSize": 14,
"labelFontStyle": "italic",
"title": "Legend - Bar Type",
"titleFontStyle": "italic",
"offset": -1100,
"padding": 400
}
},
"tooltip": [
{
"field": "Interaction",
"type": "nominal"
},
{
"field": "Interaction Product",
"type": "nominal"
},
{
"field": "Sales",
"type": "quantitative"
},
{
"field": "_sales_percent_of_total_sales_of_sets_only",
"type": "quantitative",
"title": "% of Total Sales",
"format": ".0%"
}
]
}
}
]
}
]
}
NOTE: There are alignment differences between the 3-set and 2-set versions; as a set of alignment values that worked for both versions was not found in the time set aside for development, version-specific manual values were used; as the purpose of this example was to showcase the insights from Venn Diagrams and Bar Charts, a common set of alignment values that can be shared between the 2 visuals was left as a future development exercise.
TLDR: Sample Dataset:
The dataset used was from the Microsoft AdventureWorksDW2019 sample database with dates adjusted forward by 10 years and filtered ranges of sales orders and products; the resultant data was also manually adjusted in Excel for demonstration purposes.
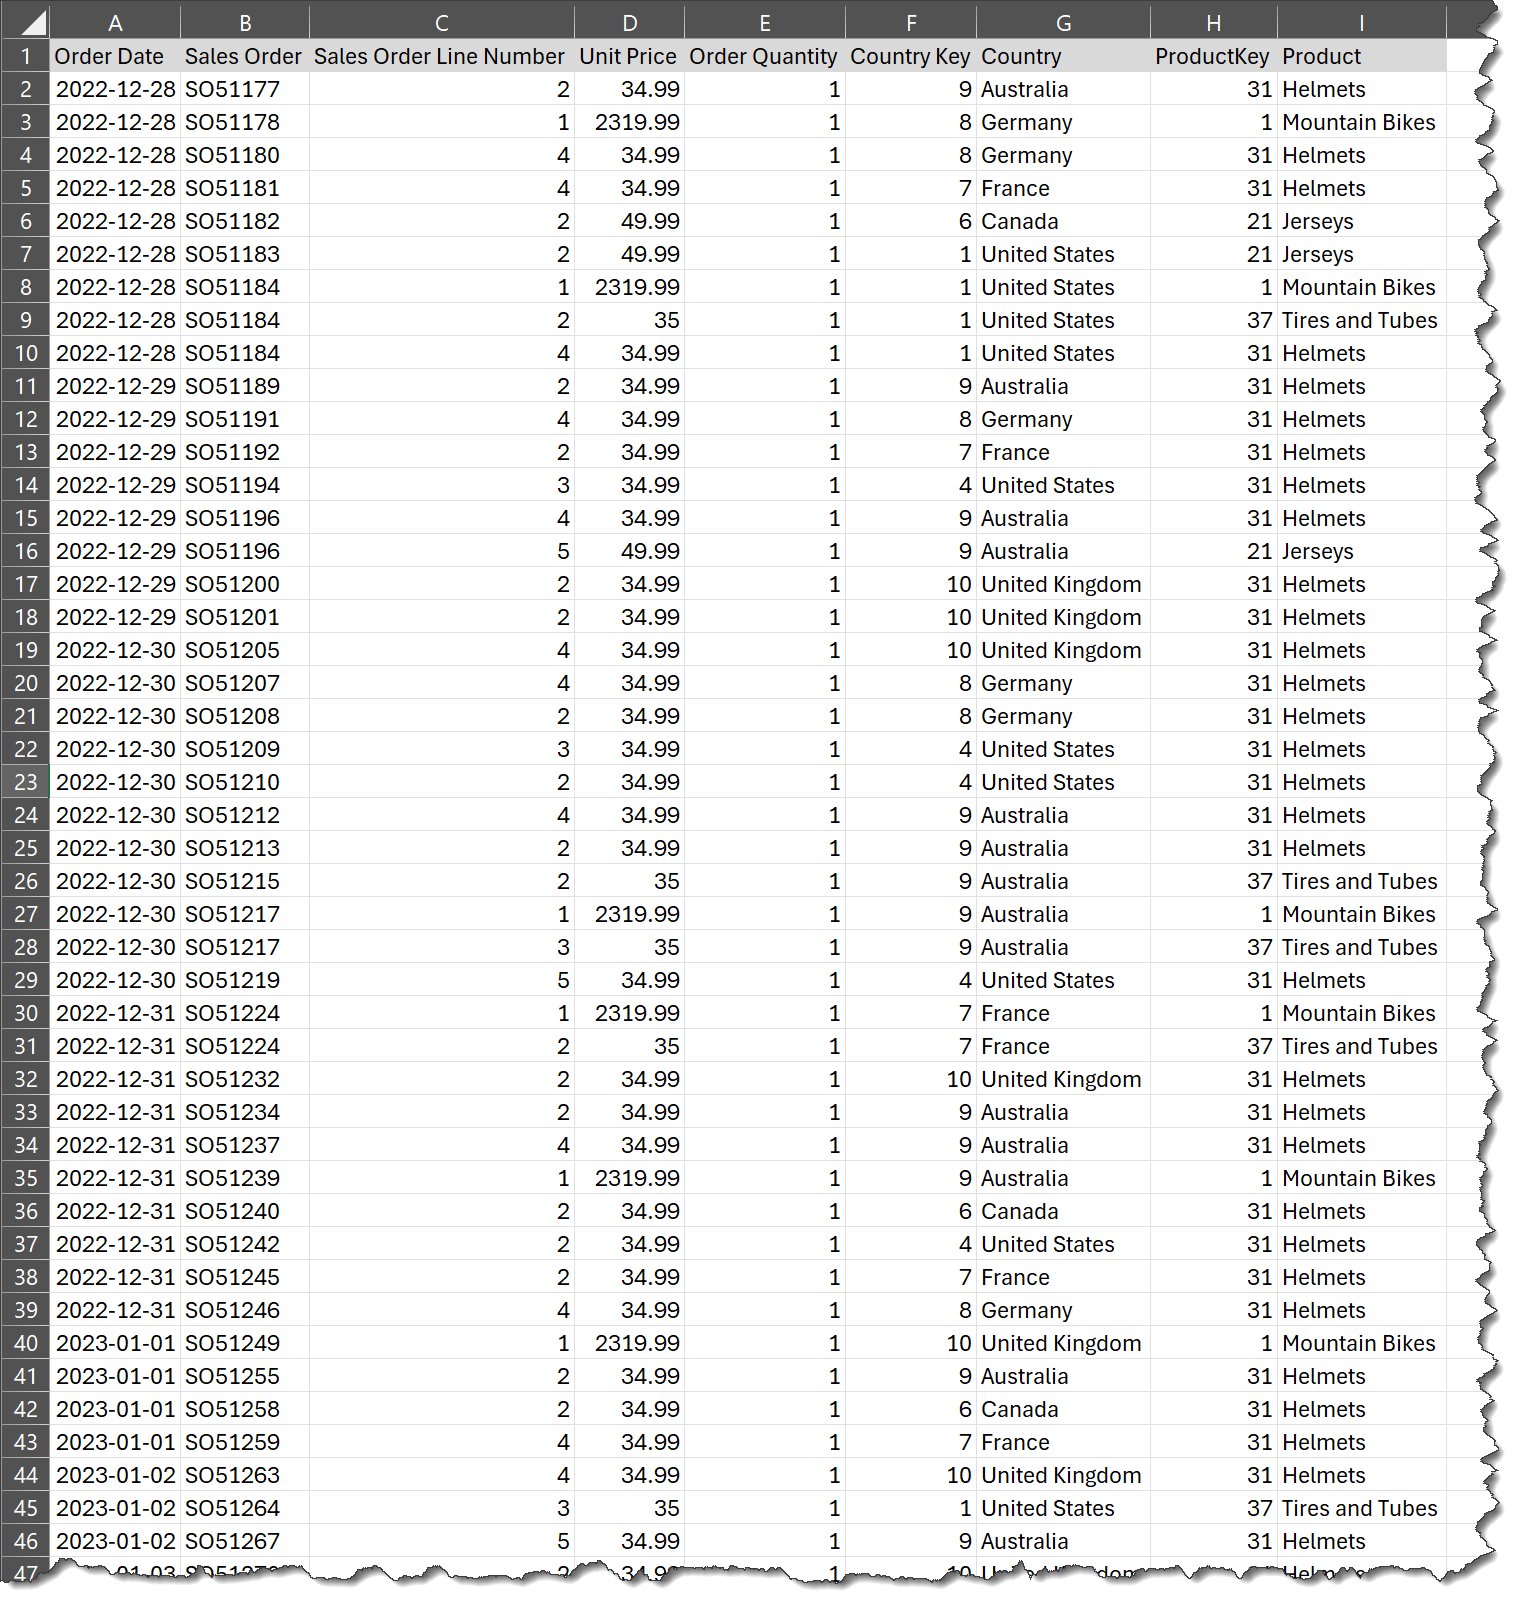
An [Interactions] table was also created as a “helper” table.
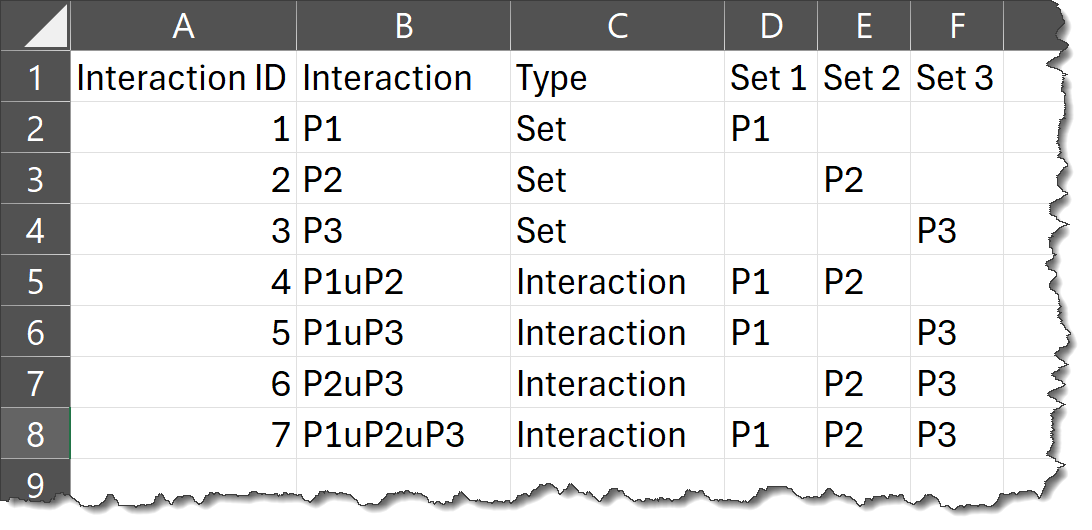
The [Sales], [Products], and [Interactions] tables were all imported as staging tables. The [RAW Sales] and [RAW Interactions] tables were referenced once, and the [RAW Products] table was referenced 3 times to provide the data model with 3 copies of the [Products] table, 1 with an active relationship to the [Sales] table and 2 with inactive relationships to the [Sales] table.

The values from the [Interactions] table were extended with DAX measures:
Total Sales =
SUMX(
  Sales,
  Sales[Order Quantity] * RELATED( 'Products 1'[Unit Price] )
)

Product Rank =
RANKX(
    ALL( 'Products 1' ),
    [Total Sales],,
    DESC
)

Interaction Product =
VAR _InteractionID = SELECTEDVALUE( Interactions[Interaction ID] )
VAR _Product1 = CALCULATE(
    MAX( 'Products 1'[Product] ),
    FILTER( 'Products 1', [Product Rank] = 1 )
)
VAR _Product2 = CALCULATE(
    MAX( 'Products 1'[Product] ),
    FILTER( 'Products 1', [Product Rank] = 2 )
)
VAR _Product3 = CALCULATE(
    MAX( 'Products 1'[Product] ),
    FILTER( 'Products 1', [Product Rank] = 3 )
)
VAR _Result = SWITCH( TRUE(),
    _InteractionID = 1, _Product1,
    _InteractionID = 2, _Product2,
    _InteractionID = 3, _Product3,
    _InteractionID = 4, _Product1 & "&" & _Product2,
    _InteractionID = 5, _Product1 & "&" & _Product3,
    _InteractionID = 6, _Product2 & "&" & _Product3,
    _InteractionID = 7, _Product1 & "&" & _Product2 & "&" & _Product3,
    BLANK()
)

RETURN
_Result

P1 Sales =
VAR _InteractionID = SELECTEDVALUE( Interactions[Interaction ID] )
VAR _Result = SWITCH( TRUE(),
    _InteractionID = 1, CALCULATE(
        [Total Sales],
        FILTER( 'Products 1', [Product Rank] = 1 ) ),
    BLANK() )

RETURN
_Result

P2 Sales =
VAR _InteractionID = SELECTEDVALUE( Interactions[Interaction ID] )
VAR _Result = SWITCH( TRUE(),
    _InteractionID = 2, CALCULATE(
        [Total Sales],
        FILTER( 'Products 1', [Product Rank] = 2 ) ),
    BLANK() )

RETURN
_Result

P3 Sales =
VAR _InteractionID = SELECTEDVALUE( Interactions[Interaction ID] )
VAR _Result = SWITCH( TRUE(),
    _InteractionID = 3, CALCULATE(
        [Total Sales],
        FILTER( 'Products 1', [Product Rank] = 3 ) ),
    BLANK() )

RETURN
_Result

P1uP2 Sales =
VAR _InteractionID = SELECTEDVALUE( Interactions[Interaction ID] )
VAR _vTableP1 = CALCULATETABLE(
    VALUES( Sales[Sales Order] ),
    USERELATIONSHIP( Sales[ProductKey],'Products 1'[ProductKey] ),
    FILTER( Sales, Sales[ProductKey] = 1 )
)
VAR _vTableP2 = CALCULATETABLE(
    VALUES( Sales[Sales Order] ),
    USERELATIONSHIP( Sales[ProductKey],'Products 2'[ProductKey] ),
    FILTER( Sales, Sales[ProductKey] = 31 )
)
VAR _vTable =
    INTERSECT( _vTableP1, _vTableP2 )
VAR _InteractionSales = CALCULATE( [Total Sales], _vTable )
VAR _Result = SWITCH( TRUE(),
        _InteractionID = 4, _InteractionSales,
        BLANK() )

RETURN
_Result

P1uP3 Sales =
VAR _InteractionID = SELECTEDVALUE( Interactions[Interaction ID] )
VAR _vTableP1 = CALCULATETABLE(
    VALUES( Sales[Sales Order] ),
    USERELATIONSHIP( Sales[ProductKey],'Products 1'[ProductKey] ),
    FILTER( Sales, Sales[ProductKey] = 1 )
)
VAR _vTableP3 = CALCULATETABLE(
    VALUES( Sales[Sales Order] ),
    USERELATIONSHIP( Sales[ProductKey],'Products 3'[ProductKey] ),
    FILTER( Sales, Sales[ProductKey] = 37 )
)
VAR _vTable =
    INTERSECT( _vTableP1, _vTableP3 )
VAR _InteractionSales = CALCULATE( [Total Sales], _vTable )
VAR _Result = SWITCH( TRUE(),
        _InteractionID = 5, _InteractionSales,
        BLANK() )

RETURN
_Result

P2uP3 Sales =
VAR _InteractionID = SELECTEDVALUE( Interactions[Interaction ID] )
VAR _vTableP2 = CALCULATETABLE(
    VALUES( Sales[Sales Order] ),
    USERELATIONSHIP( Sales[ProductKey],'Products 2'[ProductKey] ),
    FILTER( Sales, Sales[ProductKey] = 31 )
)
VAR _vTableP3 = CALCULATETABLE(
    VALUES( Sales[Sales Order] ),
    USERELATIONSHIP( Sales[ProductKey],'Products 3'[ProductKey] ),
    FILTER( Sales, Sales[ProductKey] = 37 )
)
VAR _vTable =
    INTERSECT( _vTableP2, _vTableP3 )
VAR _InteractionSales = CALCULATE( [Total Sales], _vTable )
VAR _Result = SWITCH( TRUE(),
    _InteractionID = 6, _InteractionSales,
    BLANK() )

RETURN
_Result

P1uP2uP3 Sales =
VAR _InteractionID = SELECTEDVALUE( Interactions[Interaction ID] )
VAR _vTableP1 = CALCULATETABLE(
    VALUES( Sales[Sales Order] ),
    USERELATIONSHIP( Sales[ProductKey],'Products 1'[ProductKey] ),
    FILTER( Sales, Sales[ProductKey] = 1 )
)
VAR _vTableP2 = CALCULATETABLE(
    VALUES( Sales[Sales Order] ),
    USERELATIONSHIP( Sales[ProductKey],'Products 2'[ProductKey] ),
    FILTER( Sales, Sales[ProductKey] = 31 )
)
VAR _vTableP3 = CALCULATETABLE(
    VALUES( Sales[Sales Order] ),
    USERELATIONSHIP( Sales[ProductKey],'Products 3'[ProductKey] ),
    FILTER( Sales, Sales[ProductKey] = 37 )
)
VAR _vTable =
    INTERSECT(
        INTERSECT( _vTableP1, _vTableP2 ),
        _vTableP3
    )
VAR _InteractionSales = CALCULATE( [Total Sales], _vTable )
VAR _Result = SWITCH( TRUE(),
        _InteractionID = 7, _InteractionSales,
        BLANK() )

RETURN
_Result

Sales =
VAR _Interaction = SELECTEDVALUE( Interactions[Interaction] )
VAR _Result = SWITCH( TRUE(),
    _Interaction = "P1", [P1 Sales],
    _Interaction = "P2", [P2 Sales],
    _Interaction = "P3", [P3 Sales],
    _Interaction = "P1uP2", [P1uP2 Sales],
    _Interaction = "P1uP3", [P1uP3 Sales],
    _Interaction = "P2uP3", [P2uP3 Sales],
    _Interaction = "P1uP2uP3", [P1uP2uP3 Sales],
    BLANK() )

RETURN
_Result
The final table passed the Deneb visuals:

The intent of this example is not to provide a finished visual, but rather to explore the use of the Deneb custom visual and the Vega-Lite language within Power BI and to serve as a starting point for further development.
Also included is the development PBIX using data
This example is provided as-is for information purposes only, and its use is solely at the discretion of the end user; no responsibility is assumed by the author.
Greg
Deneb Example - Venn Diagram and Bar Charts - V3.pbix (1.6 MB)