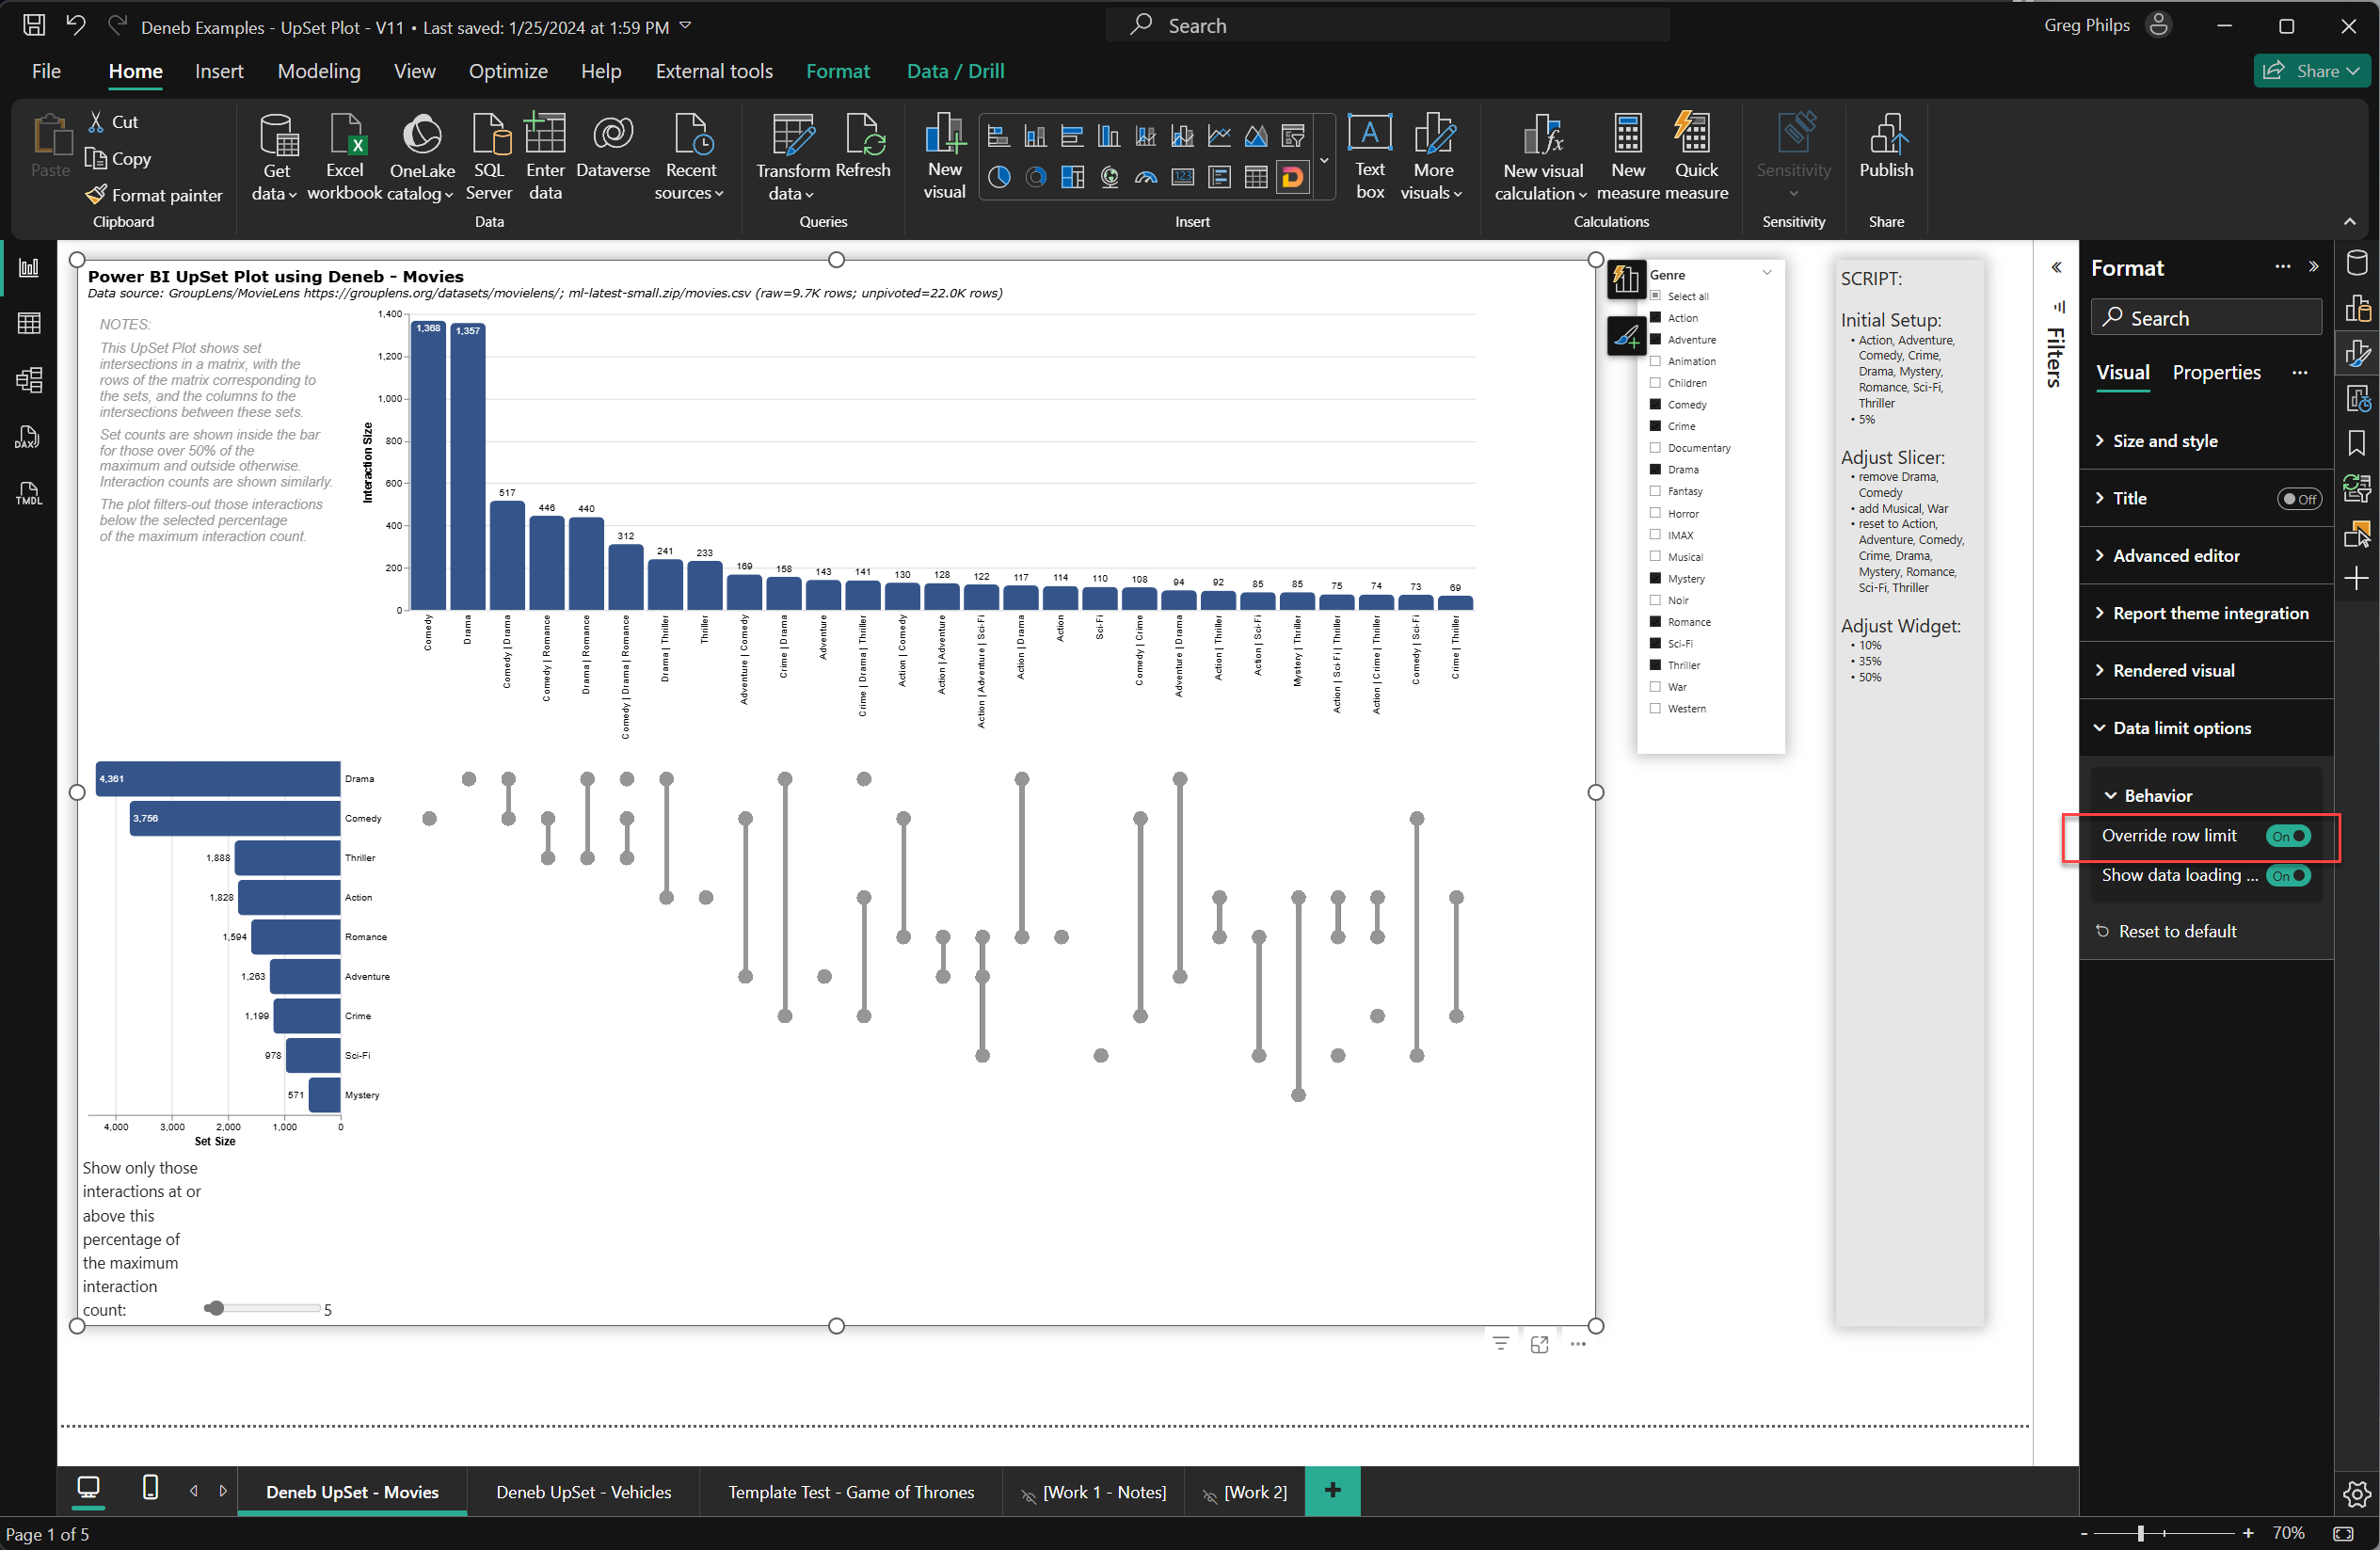
Deneb/Vega-Lite can be used to create an UpSet Plot as an alternative to a Venn Diagram for visualizing set interactions. While Venn Diagrams are useful when there are 2-and-3 set intersections, comprehension can become more difficult with a larger number of sets. An UpSet Plot can provide increased clarity for larger set interactions.
I had first heard of an UpSet Plot back in May of last year when challenged by my fellow Enterprise DNA experts to see if the Deneb custom visual for Power BI could create such a composite plot. I did produce a rough plot using a small made-up dataset consisting of 4 sets. When I saw the proof-of-concept posted to LinkedIn recently by Deneb’s creator, Daniel Marsh-Patrick, (@dm-p) (https://www.linkedin.com/posts/daniel-m-p_swdchallenge-deneb-powerbi-activity-7149638403108581376-G3Nh
), I decided to revisit the UpSet Plot, this time with the goal of producing a general Deneb/Vega-Lite template that could be applied to fit any dataset.
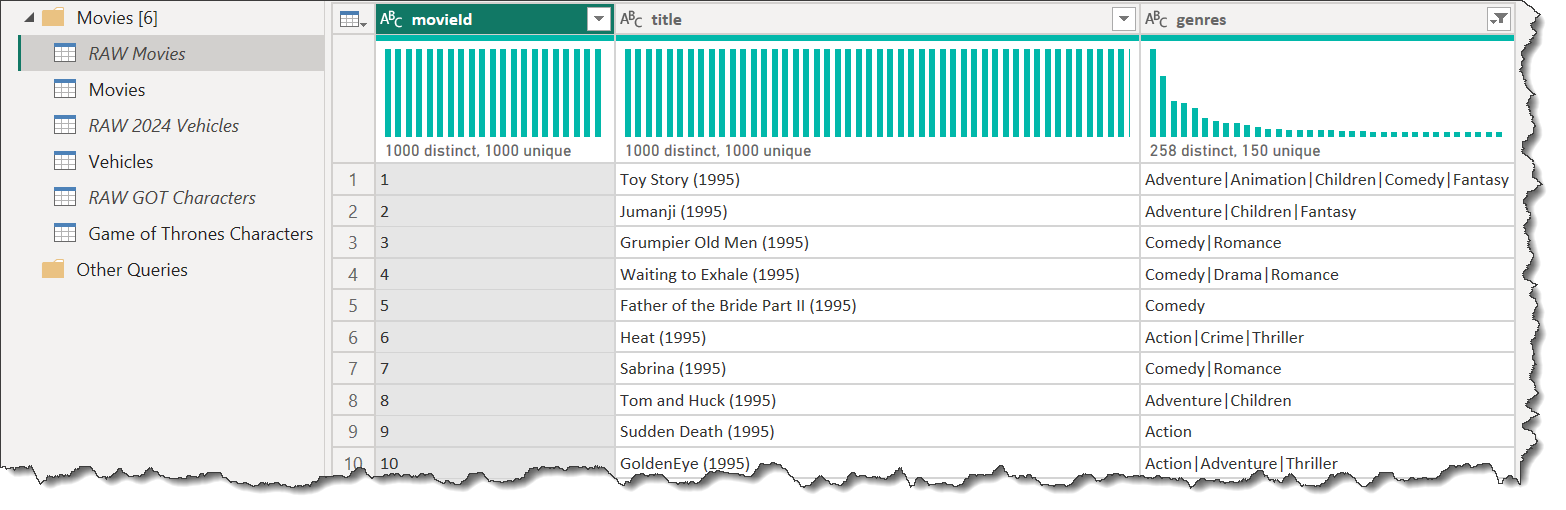
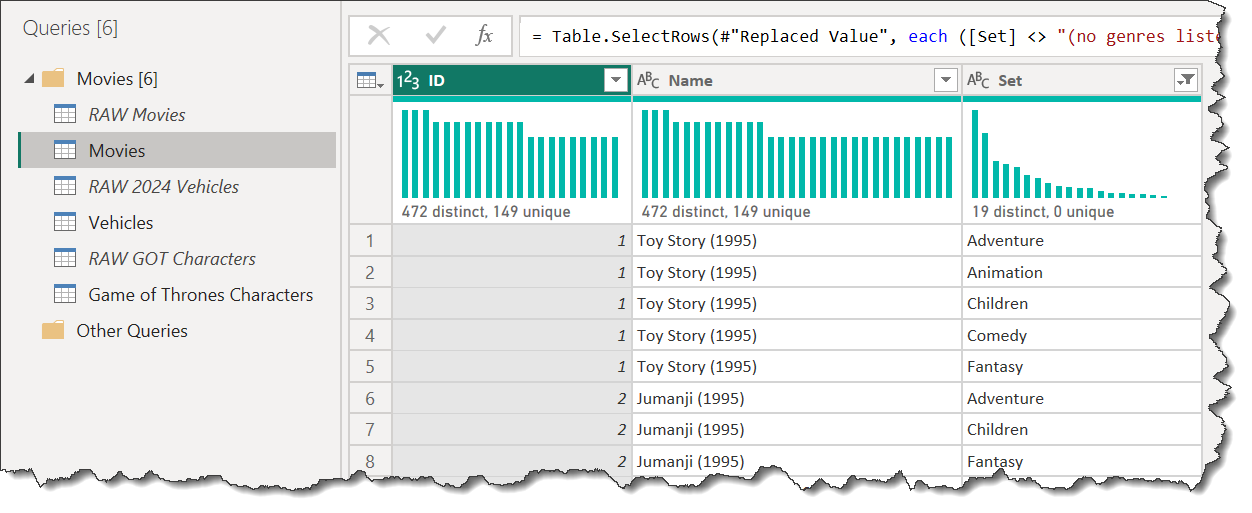
As test cases to ensure the resultant template didn’t have any hard-coding, I used three different datasets (Movie genres, Vehicle fuel economy features, and Game of Thrones characters) in my development effort. The template can be used with any dataset that has identifier and set description columns. Minimal data processing was done in Power BI, essentially just unpivoting the dataset around the identifier (filtering was used as well for the Game of Thrones dataset to reduce the number of sets). Here’s examples of the first few rows of the raw and processed movie genres dataset:
Raw:
Processed:
The only changes needed to the Deneb/Vega-Lite code after template application are adjustments to the bar colour parameter, the grid colour parameter, and the set size bar chart width (to align vertically the interaction size column chart and the interaction grid).
This solution would not have been possible without the contributions from Daniel Marsh-Patrick (@dm-p) and Madison Giammaria on the subjects of array processing, internal Vega scale names, and compiled Vega viewing.
This example illustrates a number of Deneb/Vega-Lite features, including:
0 - General:
- a common “transform” block to extend the dataset with in-visual calculations:
- use of “joinaggregate/distinct” transforms to calculate the set and interaction counts
- use of “joinaggregate/max” transforms to calculate the set and interaction maxima
- use of a “joinaggregate/values” transform to compose an array of sets for each item
- use of the “pluck” and “join” expressions to extract and concatenate the array values
- use of “window/dense_rank” transforms to rank the sets and interactions by count
- composite set labels (i.e., set rank [zero-padded], hyphen, set name)
- composite interaction labels (i.e., interaction rank [zero-padded], hyphen, interaction name)
- a common “params” block with parameters for:
- bar colour (for the bars in the set size and interaction size charts)
- grid colour (for the circles and rules in the interaction grid)
- screen widget for the interaction threshold percent (to identify the desired visibility restriction for interactions, as small interactions may not provide useful insights, in multiples of 5)
- use of a vertical concatenation block with nested horizontal concatenation blocks for (1) the notes and interaction size column chart, and for (2) the set size bar chart and interaction grid scatter chart
1 - Notes:
- a hard-coded, inline dataset for the four notes (including pipe separators to indicate the desired position of line breaks)
- a “facet/spec” operator (i.e., small multiples) to present the notes vertically with consistent spacing
- a “text” mark with the “lineBreak”: “|” key:value pair
2 - Interaction Size Column Chart:
- a nested “transform” block to extend the dataset with in-visual calculations:
- a “aggregate/distinct” transform to aggregate the interactions and to recalculate the interaction counts
- a “joinaggregate/max” transform to recalculate the interaction maxima
- a “window/dense_rank” transform to rank the interactions by count
- a “filter” block to remove aggregated interactions with count values below the percent threshold interactively selected in the “threshold” screen widget
- a shared encoding block (i.e., outside the layer block) with:
- x-axis using the interaction label (rank/name), with a “slice” expression to remove the rank from the interaction label
- y-axis using the interaction count
- a “layer” block with:
- a “bar” mark with 5 px rounded corners for the interaction
- a “text” mark for the interaction count label
- variable label position (inside the column for values over 50% of the maximum interaction count and outside otherwise)
- variable label colour (white for values over 50% of the maximum interaction count and black otherwise)
Note: Although the “bar” mark is used, the chart is rendered as a column chart as the x-axis is of type=“nominal” and the y-axis is of type=“quantitative”.
3 - Set Size Bar Chart:
- a nested “transform” block to extend the dataset with in-visual calculations:
- a “aggregate/distinct” transform to aggregate the sets and to recalculate the set counts
- a “joinaggregate/max” transform to recalculate the set maxima
- a “window/dense_rank” transform to rank the sets by count
- a shared encoding block (i.e., outside the layer block) with:
- y-axis using the set name, with a “sort” block ordering the set by set count desending
- x-axis using the set count
- a “layer” block with:
- a “bar” mark with 5 px rounded corners for the set
- a “text” mark for the set count label
- variable label position (inside the column for values over 50% of the maximum set count and outside otherwise)
- variable label colour (white for values over 50% of the maximum set count and black otherwise)
Note: The “bar” mark is used, and the chart is rendered as a bar chart as the y-axis is of type=“nominal” and the x-axis is of type=“quantitative”.
4 - Interaction Grid:
- a nested “transform” block to extend the dataset with in-visual calculations:
- a “filter” block to remove aggregated interactions with count values below the percent threshold interactively selected in the “threshold” screen widget
- 2x “calculate” transforms to get the first and last values of the set array for the interaction
- a “window/dense_rank” transform to rank the sets by count
- a shared encoding block (i.e., outside the layer block) with:
- x-axis using the interaction composite rank/name label
- a “layer” block with:
- a “circle” mark with y-axis using the set name, with a “sort” block ordering the set by set count desending
- a “rule” mark for the vertical line joining the maximum and mimimum set values for the interaction
- a nested “transform” block with a “filter” block to restrict the vertical lines to only those with multiple interactions
- use of the mark property for “y” instead of an “encoding” block such that the “scale” expression can be used with the internal Vega “scale” name for the line start
- use of the mark property for “y2” instead of an “encoding” block such that the “scale” expression can be used with the internal Vega “scale” name for the line end
Deneb/Vega-Lite JSON Code
{
"title": {
"anchor": "start",
"align": "left",
"offset": 10,
"text": "Power BI UpSet Plot using Deneb - Movies",
"font": "Verdana",
"fontSize": 16,
"fontWeight": "bold",
"fontStyle": "normal",
"subtitle": "Data source: GroupLens/MovieLens https://grouplens.org/datasets/movielens/; ml-latest-small.zip/movies.csv (raw=9.7K rows; unpivoted=22.0K rows)",
"subtitleFont": "Verdana",
"subtitleFontSize": 12,
"subtitleFontWeight": "normal",
"subtitleFontStyle": "italic"
},
"data": {"name": "dataset"},
"transform": [
{
"joinaggregate": [
{
"op": "distinct",
"field": "Set",
"as": "_number_of_sets"
}
]
},
{
"joinaggregate": [
{
"op": "distinct",
"field": "ID",
"as": "_set_count"
}
],
"groupby": ["Set"]
},
{
"joinaggregate": [
{
"op": "max",
"field": "_set_count",
"as": "_set_count_max"
}
]
},
{
"joinaggregate": [
{
"op": "values",
"field": "Set",
"as": "_set_objects"
}
],
"groupby": ["ID"]
},
{
"calculate": "pluck( datum['_set_objects'], 'Set' )",
"as": "_set_array"
},
{
"calculate": "join( datum['_set_array'], ' | ' )",
"as": "_set_string"
},
{
"joinaggregate": [
{
"op": "distinct",
"field": "ID",
"as": "_interaction_count"
}
],
"groupby": ["_set_string"]
},
{
"joinaggregate": [
{
"op": "max",
"field": "_interaction_count",
"as": "_interaction_count_max"
}
]
},
{
"window": [
{
"op": "dense_rank",
"as": "_set_rank"
}
],
"sort": [
{
"field": "_set_count",
"order": "descending"
}
]
},
{
"calculate": "pad( datum['_set_rank'], 2, '0', 'left' ) + '-' + datum['Set']",
"as": "_set_rank_set_name_label"
},
{
"window": [
{
"op": "dense_rank",
"as": "_interaction_rank"
}
],
"sort": [
{
"field": "_interaction_count",
"order": "descending"
}
]
},
{
"calculate": "pad( datum['_interaction_rank'], 2, '0', 'left' ) + '-' + datum['_set_string']",
"as": "_interaction_rank_interaction_name_label"
}
],
"params": [
{
"name": "_bar_colour",
"value": "#35558A"
},
{
"name": "_grid_colour",
"value": "#969696"
},
{
"name": "_parameter_interaction_count_percent_threshold",
"value": 5,
"bind": {
"input": "range",
"min": 0,
"max": 100,
"step": 5,
"name": "Show only those interactions at or above this percentage of the maximum interaction count: "
}
}
],
"vconcat": [
{
"name": "NOTES_AND_INTERACTION_BAR",
"spacing": 28,
"hconcat": [
{
"name": "NOTES",
"width": 250,
"height": 300,
"data": {
"values": [
{
"_id": 1,
"_note": "NOTES:"
},
{
"_id": 2,
"_note": "This UpSet Plot shows set|intersections in a matrix, with the|rows of the matrix corresponding to|the sets, and the columns to the|intersections between these sets."
},
{
"_id": 3,
"_note": "Set counts are shown inside the bar|for those over 50% of the|maximum and outside otherwise.|Interaction counts are shown similarly."
},
{
"_id": 4,
"_note": "The plot filters-out those interactions|below the selected percentage|of the maximum interaction count."
}
]
},
"spacing": 4,
"align": "none",
"facet": {
"row": {
"field": "_id",
"header": null
}
},
"spec": {
"mark": {
"type": "text",
"align": "left",
"fontSize": 14,
"fontStyle": "italic",
"fontWeight": 100,
"x": 12,
"y": 12,
"lineBreak": "|",
"color": "#969696"
},
"encoding": {
"text": {
"field": "_note",
"type": "nominal"
}
}
}
},
{
"name": "INTERACTION_BAR_CHART",
"width": {"step": 40},
"height": 300,
"transform": [
{
"aggregate": [
{
"op": "distinct",
"field": "ID",
"as": "_interaction_count"
}
],
"groupby": [
"_interaction_rank_interaction_name_label"
]
},
{
"joinaggregate": [
{
"op": "max",
"field": "_interaction_count",
"as": "_interaction_count_max"
}
]
},
{
"calculate": "datum['_interaction_count_max'] * _parameter_interaction_count_percent_threshold / 100",
"as": "_interaction_count_threshold"
},
{
"filter": "datum['_interaction_count'] >= datum['_interaction_count_threshold']"
}
],
"encoding": {
"x": {
"field": "_interaction_rank_interaction_name_label",
"type": "nominal",
"axis": {
"title": null,
"labelExpr": "slice( datum.value, 3, 100 )",
"labelAlign": "right",
"labelPadding": 4,
"labelLimit": 500,
"domain": false,
"ticks": false
}
},
"y": {
"field": "_interaction_count",
"type": "quantitative",
"axis": {
"orient": "left",
"tickCount": 6,
"title": "Interaction Size"
}
}
},
"layer": [
{
"name": "INTERACTION_COLUMN",
"mark": {
"type": "bar",
"color": {
"expr": "_bar_colour"
},
"cornerRadiusTopLeft": 5,
"cornerRadiusTopRight": 5
}
},
{
"name": "INTERACTION_COUNT_LABEL",
"mark": {
"type": "text",
"yOffset": {
"expr": "datum['_interaction_count'] < ( datum['_interaction_count_max'] / 2 ) ? -8 : 8"
},
"color": {
"expr": "datum['_interaction_count'] < ( datum['_interaction_count_max'] / 2 ) ? 'black' : 'white'"
},
"fontSize": 10
},
"encoding": {
"text": {
"field": "_interaction_count",
"type": "quantitative",
"format": ",.0f"
}
}
}
]
}
]
},
{
"name": "SET_BAR_AND_INTERACTION_SCATTER",
"encoding": {
"y": {
"field": "Set",
"type": "nominal"
}
},
"hconcat": [
{
"name": "SET_BAR_CHART",
"width": 256,
"height": {"step": 40},
"transform": [
{
"aggregate": [
{
"op": "distinct",
"field": "ID",
"as": "_set_count"
}
],
"groupby": ["Set"]
},
{
"joinaggregate": [
{
"op": "max",
"field": "_set_count",
"as": "_set_count_max"
}
]
},
{
"window": [
{
"op": "dense_rank",
"as": "_set_rank"
}
],
"sort": [
{
"field": "_set_count",
"order": "descending"
}
]
},
{
"calculate": "pad( datum['_set_rank'], 2, '0', 'left' ) + '-' + datum['Set']",
"as": "_set_rank_set_name_label"
}
],
"encoding": {
"y": {
"field": "Set",
"type": "nominal",
"sort": {
"op": "sum",
"field": "_set_count",
"order": "descending"
},
"axis": {
"title": null,
"labelAlign": "left",
"labelPadding": 4,
"domain": false,
"ticks": false,
"orient": "right"
}
},
"x": {
"field": "_set_count",
"type": "quantitative",
"scale": {
"reverse": true
},
"axis": {
"title": "Set Size",
"labelFlush": false,
"tickCount": 6
}
}
},
"layer": [
{
"name": "SET_BAR",
"mark": {
"type": "bar",
"color": {
"expr": "_bar_colour"
},
"cornerRadiusTopLeft": 5,
"cornerRadiusBottomLeft": 5
}
},
{
"name": "SET_LABEL",
"mark": {
"type": "text",
"baseline": "middle",
"fontSize": 10,
"align": {
"expr": "datum['_set_count'] < ( datum['_set_count_max'] / 2 ) ? 'right' : 'left'"
},
"xOffset": {
"expr": "datum['_set_count'] < ( datum['_set_count_max'] / 2 ) ? -4 : 4"
},
"color": {
"expr": "datum['_set_count'] < ( datum['_set_count_max'] / 2 ) ? 'black' : 'white'"
}
},
"encoding": {
"text": {
"field": "_set_count",
"type": "quantitative",
"format": ",.0f"
}
}
}
]
},
{
"name": "INTERACTION_GRID",
"width": {"step": 40},
"height": {"step": 40},
"transform": [
{
"calculate": "datum['_interaction_count_max'] * _parameter_interaction_count_percent_threshold / 100",
"as": "_interaction_threshold"
},
{
"filter": "datum['_interaction_count'] >= datum['_interaction_threshold']"
},
{
"calculate": "datum['_set_array'][0]",
"as": "_min_set_array"
},
{
"calculate": "reverse( datum['_set_array'] )[0]",
"as": "_max_set_array"
},
{
"window": [
{
"op": "dense_rank",
"as": "_set_rank"
}
],
"sort": [
{
"field": "_set_count",
"order": "descending"
}
]
},
{
"calculate": "pad( datum['_set_rank'], 2, '0', 'left' ) + '-' + datum['Set']",
"as": "_set_rank_set_name_label"
}
],
"encoding": {
"x": {
"field": "_interaction_rank_interaction_name_label",
"type": "nominal",
"axis": null
}
},
"layer": [
{
"name": "CIRCLE_SCATTER",
"mark": {
"type": "circle",
"size": 200,
"color": {
"expr": "_grid_colour"
}
},
"encoding": {
"y": {
"field": "Set",
"type": "nominal",
"sort": {
"op": "sum",
"field": "_set_count",
"order": "descending"
},
"axis": null
}
}
},
{
"name": "RULE_SCATTER",
"transform": [
{
"filter": "length( datum['_set_array'] ) > 1"
}
],
"mark": {
"type": "rule",
"strokeWidth": 4,
"color": {
"expr": "_grid_colour"
},
"y": {
"expr": "scale('INTERACTION_GRID_y', datum['_min_set_array']) + bandwidth('INTERACTION_GRID_y') / 2"
},
"y2": {
"expr": "scale('INTERACTION_GRID_y', datum['_max_set_array']) + bandwidth('INTERACTION_GRID_y') / 2"
}
}
}
]
}
]
}
]
}
The intent of this example and template is not to provide a finished visual, but rather to serve as a starting point for further development. As this is a demo only, minimal time was spent verifying and polishing the results, and possible future enhancement areas include:
- vertical lines should span all circles in interaction grid
- add lighter-coloured circles for “inactive” points in intersetion grid
- add interactivity to respond to set-and-interaction mouse clicks
- evaluate and adjust the existing “transform” blocks to reduce redundancy left over from the initial development effort
Also included is the development sample PBIX using three data sources:
1 - Movies Genres: GroupLens/MovieLens https://grouplens.org/datasets/movielens/; ml-latest-small.zip/movies.csv (raw=9.7K rows; unpivoted=22.0K rows)
2 - Vehicle Features: US Environmental Protection Agency/Fuel Economy (https://www.fueleconomy.gov/feg/download.shtml (2024 Datafile); 2024 FE Guide …xlsx (raw=819 rows; unpivoted=2.2K rows)
3 - Game of Thrones Character Descriptors: https://www.kaggle.com/datasets/mylesoneill/game-of-thrones/character-predictions.csv (rows=1.9K; unpivoted and filtered (House={Baratheon, Frey, Greyjoy, Lannister, Stark})=983 rows)
This example is provided as-is for information purposes only, and its use is solely at the discretion of the end user; no responsibility is assumed by the author.
Greg
Deneb Examples - UpSet Plot - V11.pbix (1.8 MB)
deneb.upset_plot.0.2.json (20.7 KB)