Deneb/Vega-Lite can be used to generate a Financial Waterfall, which graphically depicts the major elements of a profit and loss statement.
(Perhaps its just the engineer in me, but I’ve always found P&L statements difficult to read and wanted to see if Deneb could help make the comparisons more visible.)
The example presented herein uses a ranged column chart and data label arrays to increase the utility of the visual. A simple year slicer is included, and a percent toggle (gross revenue; previous statistic) is included to provide interactivity.
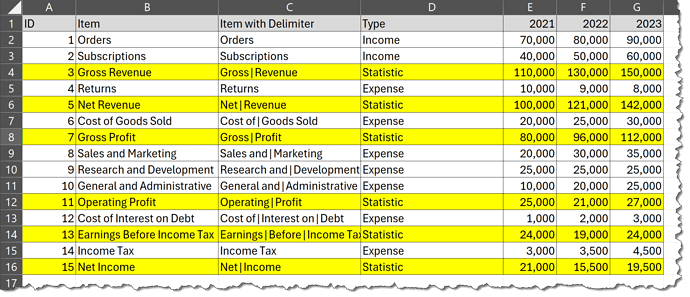
As this was primarily a Deneb investigation, and as I have minimal financial experience, minimal time was spent sourcing a representative dataset, and in the end a simple dataset representing some common P&L categories was synthesized.
This example illustrates a number of Deneb/Vega-Lite features, including:
0 - General:
- a “title” block with subtitle
- a shared “params” block with:
- radio buttons (gross revenue; previous statistic) to select the percent target
- a shared “transform” block with:
- a “calculate” transform to compose an expanded item identifier (id, type, delimited name) to ease sorting and to make the id, type, and delimited name available for axis processing
- a “calculate” transform to determine the signed increment amount
- a “window/sum” transform to determine the cumulative amount for the range top amount
- a “calculate” transform to determine the range bottom amount (statistic = 0)
- 5x “calculate” transforms and 5x “joinaggregate/sum” transforms to determine the statistic amounts
- 3x “calculate” transforms to determine the percentages
- 3x “calculate” transforms to format and compose the data label array
- a “vconcat” block for the custom legend and column chart
1 - Legend:
- a 3-record in-line dataset (income, expense, statistic)
- an “arc” mark of zero size to leverage the legend functionality built-in to Vega-Lite
- a “color” encoding with:
- a hard-coded scale (domain and range) for the colours
- conditional label font size, weight, and position and conditional symbol size (statistic larger and bold)
2 - Waterfall:
- a shared “encoding” block to ensure all marks use the same X and Y axes and colours
- the X axis configured with:
- multi-line labels for the items (split into an array using the delimiter)
- conditional font size (statistic larger)
- conditional font weight (statistic bold)
- the Y axis configured with:
- both a Y (top) and Y2 (bottom) to create an amount range
- the X axis configured with:
- a “layer” block with:
- a “bar” mark for the columns with conditional colour
- a “text” mark for the amount/percent labels with:
- conditional font size, weight, and colour (statistic larger, bold, white)
- conditional label position (income above, expense and statistic below)
Deneb/Vega-Lite JSON Code:
{
  "title": {
    "anchor": "start",
    "align": "left",
    "offset": 20,
    "text": "Power BI Financial Waterfall using Deneb",
    "font": "Verdana",
    "fontSize": 24,
    "fontWeight": "bold",
    "fontStyle": "normal",
    "subtitle": "Data Source: synthetic data",
    "subtitleFont": "Verdana",
    "subtitleFontSize": 16,
    "subtitleFontWeight": "normal",
    "subtitleFontStyle": "italic"
  },
  "data": {
    "name": "dataset"
  },
  "params": [
    {
      "name": "_percent_target",
      "value": "of Gross Revenue",
      "bind": {
        "input": "radio",
        "options": [
          "of Gross Revenue",
          "of Previous Statistic"
        ],
        "name": "Percent: "
      }
    }
  ],
  "transform": [
    {
      "calculate": "pad( datum['ID'], 2, '0', 'left' ) + '-' + slice( datum['Type'], 0, 1 ) + '-' + datum['Item with Delimiter']",
      "as": "_item_id_type_name"
    },
    {
      "calculate": "datum['Type'] == 'Income' ? datum['Amount'] : datum['Type'] == 'Expense' ? -1 * datum['Amount'] : 0",
      "as": "_increment_amount"
    },
    {
      "window": [
        {
          "op": "sum",
          "field": "_increment_amount",
          "as": "_top_amount"
        }
      ],
      "sort": [
        {
          "field": "ID",
          "order": "ascending"
        }
      ],
      "frame": [
        null,
        0
      ]
    },
    {
      "calculate": "datum['Type'] == 'Statistic' ? 0 : datum['_top_amount'] - datum['_increment_amount']",
      "as": "_bottom_amount"
    },
    {
      "calculate": "datum['Item'] == 'Gross Revenue' ? datum['Amount'] : 0",
      "as": "_gross_revenue"
    },
    {
      "calculate": "datum['Item'] == 'Net Revenue' ? datum['Amount'] : 0",
      "as": "_net_revenue"
    },
    {
      "calculate": "datum['Item'] == 'Gross Profit' ? datum['Amount'] : 0",
      "as": "_gross_profit"
    },
    {
      "calculate": "datum['Item'] == 'Operating Profit' ? datum['Amount'] : 0",
      "as": "_operating_profit"
    },
    {
      "calculate": "datum['Item'] == 'Earnings Before Income Tax' ? datum['Amount'] : 0",
      "as": "_earnings_before_income_tax"
    },
    {
      "joinaggregate": [
        {
          "op": "sum",
          "field": "_gross_revenue",
          "as": "_gross_revenue_amount"
        }
      ]
    },
    {
      "joinaggregate": [
        {
          "op": "sum",
          "field": "_net_revenue",
          "as": "_net_revenue_amount"
        }
      ]
    },
    {
      "joinaggregate": [
        {
          "op": "sum",
          "field": "_gross_profit",
          "as": "_gross_profit_amount"
        }
      ]
    },
    {
      "joinaggregate": [
        {
          "op": "sum",
          "field": "_operating_profit",
          "as": "_operating_profit_amount"
        }
      ]
    },
    {
      "joinaggregate": [
        {
          "op": "sum",
          "field": "_earnings_before_income_tax",
          "as": "_earnings_before_income_tax_amount"
        }
      ]
    },
    {
      "calculate": "datum['Amount'] / datum['_gross_revenue_amount']",
      "as": "_percent_of_gross_revenue"
    },
    {
      "calculate": "datum['Item'] == 'Returns' ? datum['Amount'] / datum['_gross_revenue_amount'] : datum['Item'] == 'Cost of Goods Sold' ? datum['Amount'] / datum['_net_revenue_amount'] : datum['Item'] == 'Sales and Marketing' ? datum['Amount'] / datum['_gross_profit_amount'] : datum['Item'] == 'Research and Development' ? datum['Amount'] / datum['_gross_profit_amount'] : datum['Item'] == 'General and Administrative' ? datum['Amount'] / datum['_gross_profit_amount'] : datum['Item'] == 'Cost of Interest on Debt' ? datum['Amount'] / datum['_operating_profit_amount'] : datum['Item'] == 'Income Tax' ? datum['Amount'] / datum['_earnings_before_income_tax_amount'] : null",
      "as": "_percent_of_previous_statistic"
    },
    {
      "calculate": "_percent_target == 'of Previous Statistic' ? datum['_percent_of_previous_statistic'] : datum['_percent_of_gross_revenue']",
      "as": "_percent"
    },
    // label arrays
    {
      "calculate": "datum['Amount'] < 10000 ? format( datum['Amount'], '.2s' ) : format( datum['Amount'], '.3s' )",
      "as": "_label_amount"
    },
    {
      "calculate": "isValid( datum['_percent'] ) ? datum['_percent'] < 0.2 ? format( datum['_percent'], '.1%' ) : format( datum['_percent'], '.0%' ) : null",
      "as": "_label_percent"
    },
    {
      "calculate": "[ datum['_label_amount'], datum['_label_percent'] ]",
      "as": "_label_array"
    }
  ],
  "spacing": 30,
  "vconcat": [
    {
      "name": "LEGEND",
      "width": 1180,
      "height": 1,
      "data": {
        "values": [
          {
            "legend_id": 1,
            "legend_size": 2,
            "legend_label": "Statistic"
          },
          {
            "legend_id": 2,
            "legend_size": 1,
            "legend_label": "Income"
          },
          {
            "legend_id": 3,
            "legend_size": 1,
            "legend_label": "Expense"
          }
        ]
      },
      "mark": {
        "type": "arc",
        "radius": 0
      },
      "encoding": {
        "theta": {
          "field": "legend_size",
          "type": "quantitative"
        },
        "color": {
          "field": "legend_label",
          "type": "nominal",
          "scale": {
            "domain": [
              "Statistic",
              "Income",
              "Expense"
            ],
            "range": [
              "#0F4C81",
              "#217356",
              "#7F2E42"
            ]
          },
          "legend": {
            "direction": "horizontal",
            "title": null,
            "orient": "none",
            "legendX": -60,
            "labelColor": "black",
            "labelFont": "Segoe UI",
            "labelFontStyle": "italic",
            "labelFontSize": {
              "expr": "datum.value == 'Statistic' ? 14 : 12"
            },
            "labelFontWeight": {
              "expr": "datum.value == 'Statistic' ? 'bold' : 'normal'"
            },
            "labelOffset": {
              "expr": "datum.value == 'Statistic' ? 8 : 4"
            },
            "labelBaseline": "top",
            "symbolType": "circle",
            "symbolSize": {
              "expr": "datum.value == 'Statistic' ? 600 : 300"
            },
            "symbolOpacity": 0.7
          }
        }
      }
    },
    {
      "name": "WATERFALL",
      "width": 1180,
      "height": 510,
      "encoding": {
        "x": {
          "field": "_item_id_type_name",
          "type": "nominal",
          "axis": {
            "title": null,
            "labelAngle": 0,
            "labelExpr": "split( slice( datum.value, 5, 100 ), '|' )",
            "labelFontWeight": {
              "expr": "slice( datum.value, 3, 4 ) == 'S' ? 'bold' : 'normal'"
            },
            "labelFontSize": {
              "expr": "slice( datum.value, 3, 4 ) == 'S' ? 14 : 10"
            }
          }
        },
        "y": {
          "field": "_top_amount",
          "type": "quantitative",
          "axis": {
            "title": "Amount",
            "labelExpr": "datum.value == 0 ? 0 : format( datum.value, '.2s')"
          },
          "scale": {
            "domain": [
              0,
              160000
            ]
          }
        },
        "y2": {
          "field": "_bottom_amount"
        }
      },
      "layer": [
        {
          "name": "COLUMN_CHART",
          "mark": {
            "type": "bar",
            "color": {
              "expr": "datum['Type'] == 'Income' ? '#217356' : datum['Type'] == 'Expense' ? '#7F2E42' : '#0F4C81'"
            },
            "opacity": 0.7
          }
        },
        {
          "name": "DATA_LABELS",
          "mark": {
            "type": "text",
            "fontStyle": "italic",
            "fontWeight": {
              "expr": "datum['Type'] == 'Statistic' ? 'bold' : 'normal'"
            },
            "fontSize": {
              "expr": "datum['Type'] == 'Statistic' ? 16 : 12"
            },
            "yOffset": {
              "expr": "datum['Type'] == 'Income' && isValid( datum['_percent'] ) ? -22 : datum['Type'] == 'Income' && ! isValid( datum['_percent'] ) ? -10 : 10"
            },
            "color": {
              "expr": "datum['Type'] == 'Statistic' ? 'white' : 'black'"
            }
          },
          "encoding": {
            "text": {
              "field": "_label_array"
            }
          }
        }
      ]
    }
  ]
}
Also included is the development sample PBIX using the synthetic dataset described above.
The intent of this example was not to provide a finished visual, but rather to explore the use of the Deneb custom visual and the Vega-Lite language within Power BI and to serve as a starting point for further development.
This example is provided as-is for information purposes only, and its use is solely at the discretion of the end user; no responsibility is assumed by the author.
Greg
Deneb Example - Financial Waterfall - V9.pbix (2.3 MB)


