Deneb/Vega-Lite can be used to add category enclosures to subcategory data in Power BI. These enclosures can be augmented with labels and values to increase the information presented.
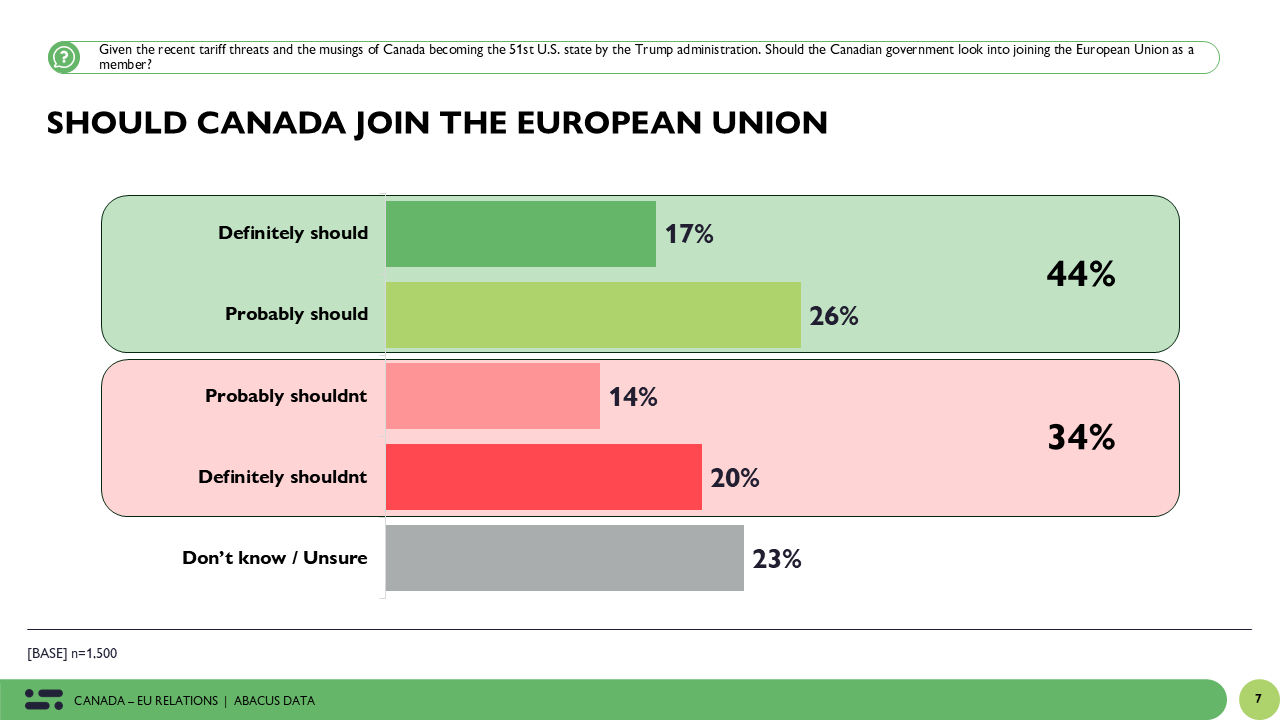
I first saw an example of this last month in a post by Abacus Data on what Canadians think about Canada joining the European Union:
and specifically in this visual:
I thought Deneb/Vega-Lite might be a good candidate to apply a similar concept to survey data, and was introduced to the name “enclosures” by Anastasiya Kuznetsova in her recent post:
Further, in the past couple of days, I also saw posts by Kevin Flerlage and Daniel Marsh-Patrick applying a similar concept to an alternative to a stacked bar chart:
The example herein presents synthetic subcategory survey data with positive and negative category enclosures and values.
This example illustrates a number of Deneb/Vega-Lite features, including:
0 - General:
- a “title” block with subtitle
- a shared “transform” block with:
- a “calculate” transform to determine the ID (category ID * 100 + subcategory ID)
- an outside “layer” block for nested layers for category and subcategory data
1 - Category:
- a nested “transform” block with:
- 3x “joinaggregate” transforms to calculate the category maximum ID, the category minimum ID, and the category total percent
- a “filter” transform to restrict the dataset to only records for the positive and negative categories
- a “window/rank” transform to rank the subcategories by category
- a “filter” transform to restrict the dataset to only 1 record each for the positive and negative categories
- a nested “layer” block with:
- a “rect” mark with conditional colour (positive=green, negative=red) and 20% opacity
- a “text” mark for the category label (center alignment, rotated 270 degrees)
- a “text” mark for the category percent (right alignment)
2 - Subcategory:
- a nested “layer” block with:
- a nested “transform” block with:
- 2x “window/rank” transforms to determine the subcategory rank within its’ category
- 2x “calculate” transforms to determine the conditional subcategory opacity (positive=ascending, negative=descending)
- a “bar” mark with conditional colour (positive=green, negative=red, neutral=gray) and conditional opacity (as calculated in the transform above)
- a “text” mark for the subcategory label (right alignment)
- a “text” mark for the subcategory percent (left alignment)
- a nested “transform” block with:
Deneb/Vega-Lite JSON Code:
{
  "title": {
    "anchor": "start",
    "align": "left",
    "offset": 20,
    "text": "Power BI Category Enclosures using Deneb",
    "font": "Verdana",
    "fontSize": 24,
    "fontWeight": "bold",
    "fontStyle": "normal",
    "subtitle": "Synthetic Survey Data",
    "subtitleFont": "Verdana",
    "subtitleFontSize": 16,
    "subtitleFontWeight": "normal",
    "subtitleFontStyle": "italic"
  },
  "data": {
    "name": "dataset"
  },
  "transform": [
    {
      "calculate": "( datum['Category ID'] * 100 ) + ( datum['Subcategory ID'] * 1 )",
      "as": "_id"
    }
  ],
  "encoding": {
    "y": {
      "field": "_id",
      "type": "nominal",
      "axis": null
    },
    "x": {
      "field": "Percent",
      "type": "quantitative",
      "scale": {
        "domain": [
          -0.15,
          0.50
        ]
      },
      "axis": {
        "values": [
          0.0,
          0.1,
          0.2,
          0.3,
          0.4,
          0.5
        ],
        "labels": false,
        "ticks": false,
        "domain": false,
        "title": null
      }
    }
  },
  "layer": [
    {
      "name": "CATEGORY",
      "transform": [
        {
          "joinaggregate": [
            {
              "op": "min",
              "field": "_id",
              "as": "_category_min"
            },
            {
              "op": "max",
              "field": "_id",
              "as": "_category_max"
            },
            {
              "op": "sum",
              "field": "Percent",
              "as": "_category_percent"
            }
          ],
          "groupby": [
            "Category ID"
          ]
        },
        {
          "filter": "datum['Category'] != 'Neutral'"
        },
        {
          "window": [
            {
              "op": "rank",
              "as": "_subcategory_id_rank"
            }
          ],
          "groupby": [
            "Category ID"
          ],
          "sort": [
            {
              "field": "Subcategory ID",
              "order": "ascending"
            }
          ]
        },
        {
          "filter": "datum['_subcategory_id_rank'] == 1"
        }
      ],
      "layer": [
        {
          "name": "CATEGORY_BAR",
          "mark": {
            "type": "rect",
            "cornerRadius": 8,
            "yOffset": -49,
            "y2Offset": 49,
            "color": {
              "expr": "datum['Category'] == 'Positive' ? 'green' : 'red'"
            },
            "opacity": 0.2
          },
          "encoding": {
            "x": {
              "datum": -0.15
            },
            "x2": {
              "datum": 0.45
            },
            "y": {
              "field": "_category_min"
            },
            "y2": {
              "field": "_category_max"
            }
          }
        },
        {
          "name": "CATEGORY_LABEL",
          "mark": {
            "type": "text",
            "align": "center",
            "angle": 270,
            "fontSize": 24,
            "fontWeight": "bold",
            "yOffset": 50
          },
          "encoding": {
            "text": {
              "field": "Category"
            },
            "x": {
              "datum": -0.12
            }
          }
        },
        {
          "name": "CATEGORY_PERCENT",
          "mark": {
            "type": "text",
            "align": "right",
            "fontSize": 18,
            "fontWeight": "bold",
            "yOffset": 50
          },
          "encoding": {
            "text": {
              "field": "_category_percent",
              "format": ".0%"
            },
            "x": {
              "datum": 0.44
            }
          }
        }
      ]
    },
    {
      "name": "SUBCATEGORY",
      "layer": [
        {
          "name": "SUBCATEGORY_BAR",
          "transform": [
            {
              "window": [
                {
                  "op": "rank",
                  "as": "_subcategory_rank_asc"
                }
              ],
              "groupby": [
                "Category"
              ],
              "sort": [
                {
                  "field": "Subcategory ID",
                  "order": "ascending"
                }
              ]
            },
            {
              "window": [
                {
                  "op": "rank",
                  "as": "_subcategory_rank_desc"
                }
              ],
              "groupby": [
                "Category"
              ],
              "sort": [
                {
                  "field": "Subcategory ID",
                  "order": "descending"
                }
              ]
            },
            {
              "calculate": "datum['Category'] == 'Positive' ? datum['_subcategory_rank_asc'] : datum['Category'] == 'Negative' ? datum['_subcategory_rank_desc'] : 1",
              "as": "_subcategory_opacity"
            },
            {
              "calculate": "1 - ( datum['_subcategory_opacity'] * 0.4 )",
              "as": "_subcategory_opacity"
            }
          ],
          "mark": {
            "type": "bar",
            "cornerRadius": 8,
            "height": {
              "band": 0.7
            },
            "color": {
              "expr": "datum['Category'] == 'Positive' ? 'green' : datum['Category'] == 'Negative' ? 'red' : '#C9C9C9'"
            },
            "opacity": {
              "expr": "datum['_subcategory_opacity']"
            }
          }
        },
        {
          "name": "SUBCATEGORY_LABEL",
          "mark": {
            "type": "text",
            "align": "right",
            "xOffset": -10,
            "fontSize": 14
          },
          "encoding": {
            "text": {
              "field": "Subcategory"
            },
            "x": {
              "datum": 0
            }
          }
        },
        {
          "name": "SUBCATEGORY_PERCENT",
          "mark": {
            "type": "text",
            "align": "left",
            "xOffset": 10,
            "fontSize": 14
          },
          "encoding": {
            "text": {
              "field": "Percent",
              "format": ".0%"
            }
          }
        }
      ]
    }
  ]
}
Also included is the development sample PBIX using, as noted above, synthetic survey data.
NOTE: This was a quick-and-dirty development effort, and the first method that worked for each design element was left as-is; this prototype could undoubtably benefit greatly from refinement, but as the point of this effort was to produce a proof-of-concept, design enhancements are left as exercises for further development.
The intent of this example was not to provide a finished visual, but rather to explore the use of the Deneb custom visual and the Vega-Lite language within Power BI and to serve as a starting point for further development.
This example is provided as-is for information purposes only, and its use is solely at the discretion of the end user; no responsibility is assumed by the author.
Greg
Deneb Example - Category Enclosures - V4.pbix (4.6 MB)