Hello,
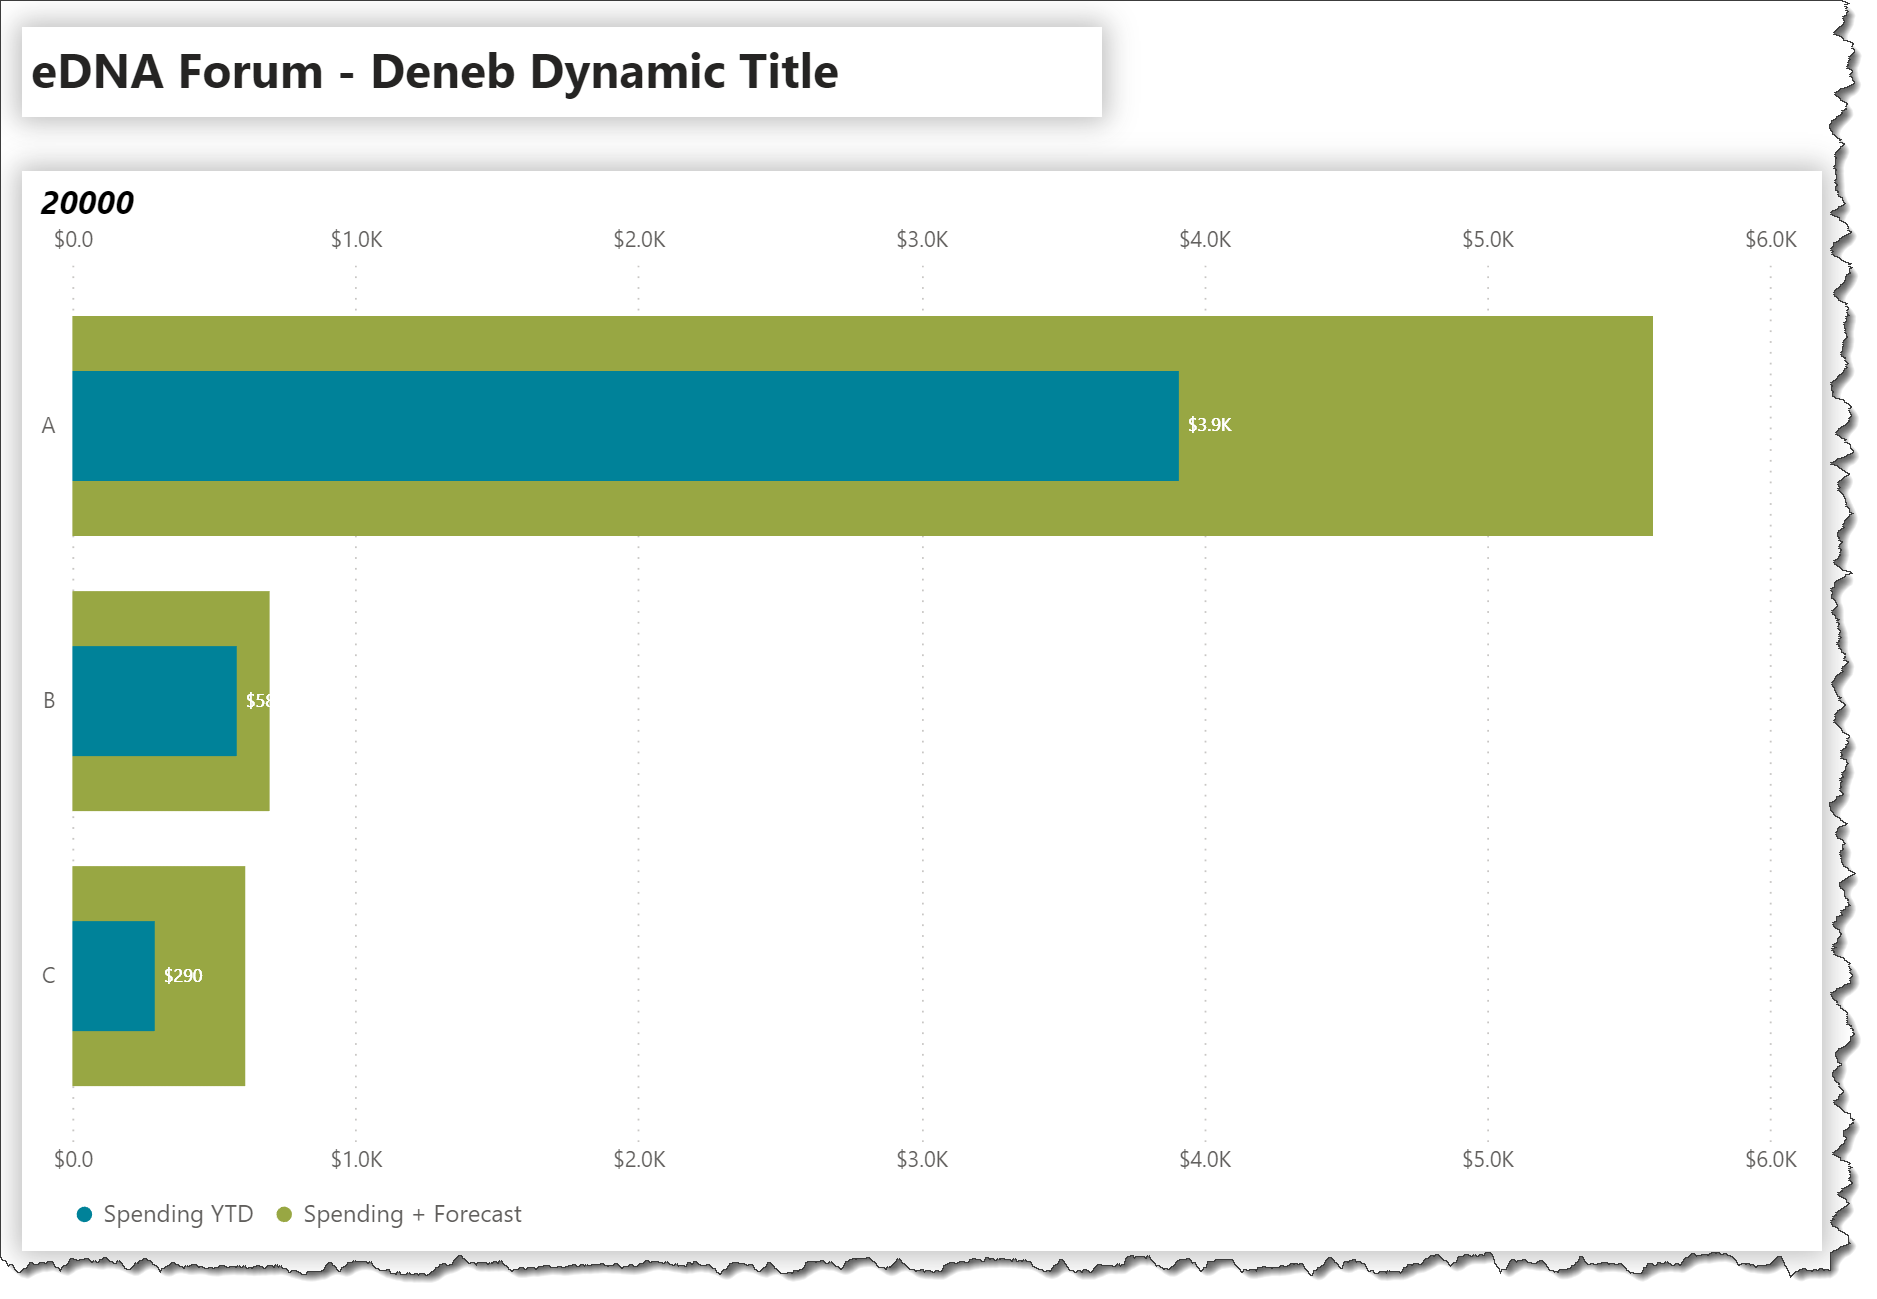
I was asked on a DENEB chart to add the total of the measures I have split by category in the chart as an addition to the tile.
So practically aggregate by measure and add it to the chart title…
I’m sure that it can be done in Deneb using Vega-Lite, but you could also remove the title from the Vega-Lite specification and use Power BI to add the title to the Deneb visual. Just create a separate measure called “Chart Title” (or whatever you want to call it), and use Power BI’s custom formatting to assign this measure as the Deneb visual’s title. Your measure could be something like this:
Chart Title = "YTD Acutal/EOY Plan by Category (Total YTD = " & FORMAT([Spending YTD], "$#,##0,.0K") & ")"
As @DaveC said, its probably easiest to do this in Power BI directly. In Vega-Lite, you can add an expression to the title text, but it seems to need to be self-contained; AFAIK you can’t dynamically set the title text (also haven’t seen examples).