Hi all,
I’m having an issue with DENEB visual. I followed along a tutorial on creating a heatmap combo chart (link to tutorial below) and I have been able to make it work for my project but for one feature.
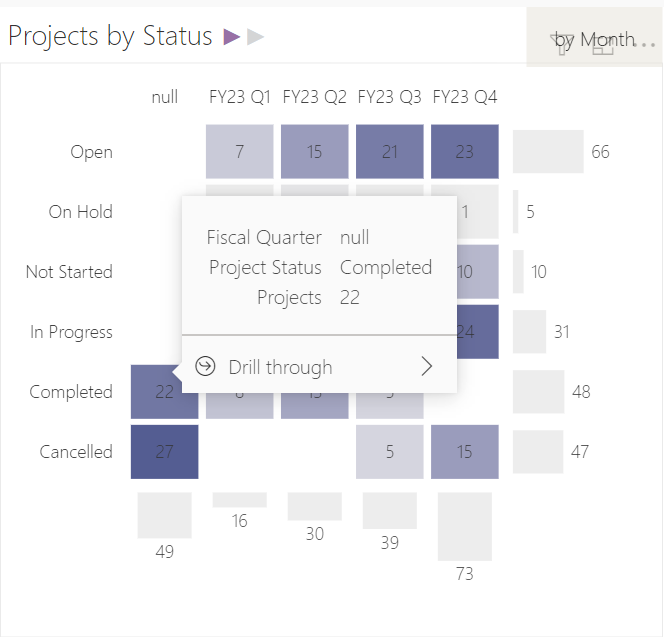
the drill through functionality work as expected on the heatmap itself, but when hovering over the horizontal or vertical bar charts, the option in the tooltip is no longer available.
Reading through the documentation I gathered that the issue is with the row context.
what I expect for the visual to do, is to be able to navigate to the detail table and see all projects that are in the same category. For example, when looking at the open count of projects in the vertical bar chart, the count shows as 66, and this is because on the I have aggregated the project count in the x-axis. so the drill-through should take the user to the detail table showing all 66 rows of data.
I’m not very familiar with DENEB, still learning, so any help/suggestion I can try to solve this will be much appreciated ![]()
thanks,
Erika
below is the json file for your reference.
Link to tutorial: https://www.youtube.com/watch?v=FlzlSozY3VE
heatmap_CAPEX_v1.vega (8.5 KB)