Deneb - Domain Max question

Hello,
I am having an issue using “DomainMax”. When Vega-lite does the scaling in my case, the highest bar is very close to the top of the chart, so I would like to give it more “room to breathe” by taking the max of the value for the y axis and multiplying it by a factor.
So I tried first to go for the simple max. From the Vega-lite documentation, it should be possible to use an expression https://vega.github.io/vega-lite/docs/scale.html#domain
I am not sure why it does not work in my case - the max seems to be calculated correctly, but when I pass it on in the encoding, it does not work any longer and the visuals goes blank.
If I use a number instead of an expression, everything works fine.
I must be doing something wrong somewhere, but what?
Or maybe should I be taking another approach?

Thanks!!!
Kind regards
Valeria

Reporting Training Support Usage App - eDNA question.pbix (1.6 MB)

Hi @valeriabreveglieri

OK, took a look at the issue, and had the same results as you … the visual blanked-out when using an expression with a field reference. When I use a math expression with direct numbers (i.e., without a field reference) it seems to work fine.

Here’s the code that worked for me:

      "encoding": {
        "y": {
          "field": "# Count of Launches",
          "type": "quantitative",
          "scale": {
            "domainMax": {
              "expr": "37 * 2.4"
            }
          }
        }
      }

Not sure why. I’ll keep my eyes open and post if I find anything.
Greg
eDNA Forum - Deneb Domain Max.pbix (1.6 MB)

1 Like

thanks @Greg ! In the meantime I guess a workaround would be to create a DAX measure x% increased vs. the original one, and add it as a transparent mark to the chart. I will give it a try…
thanks
kind regards
Valeria

This is probably not very helpful since it is Vega instead of Vega-Lite, but here’s what has worked for me. There’s a lot more to the whole specification, but these are the relevant parts…

"signals": [
    {
      "name": "maxDomainValue",
      "update": "max(data('dataset')[0].maxIncidents, 1)"
    }
  ],

  "data": [
        {
          "type": "joinaggregate",
          "ops": ["max"],
          "fields": ["Incidents"],
          "as": ["maxIncidents"]
        }
      ]
    }
  ],

  "scales": [
    {
      "name": "yscale",
      "domain": {
        "data": "dataset",
        "field": "Incidents"
      },
      "domainMax": {"signal": "maxDomainValue"},
      "nice": true,
      "range": "height"
    }
  ]
2 Likes

Hi @valeriabreveglieri,

@DaveC is correct in the approach, and it’ll be similar for Vega-Lite.

Scales and axes don’t look at the dataset on a row by rows basis, so calculating the maximum value as a transform will not be something that domainMax can obtain. It will ideally need to be a signal (param in Vega-Lite).

The strategy I would take is to get the extents (min/max) of the column values, find the max and multiply this by an appropriate amount.

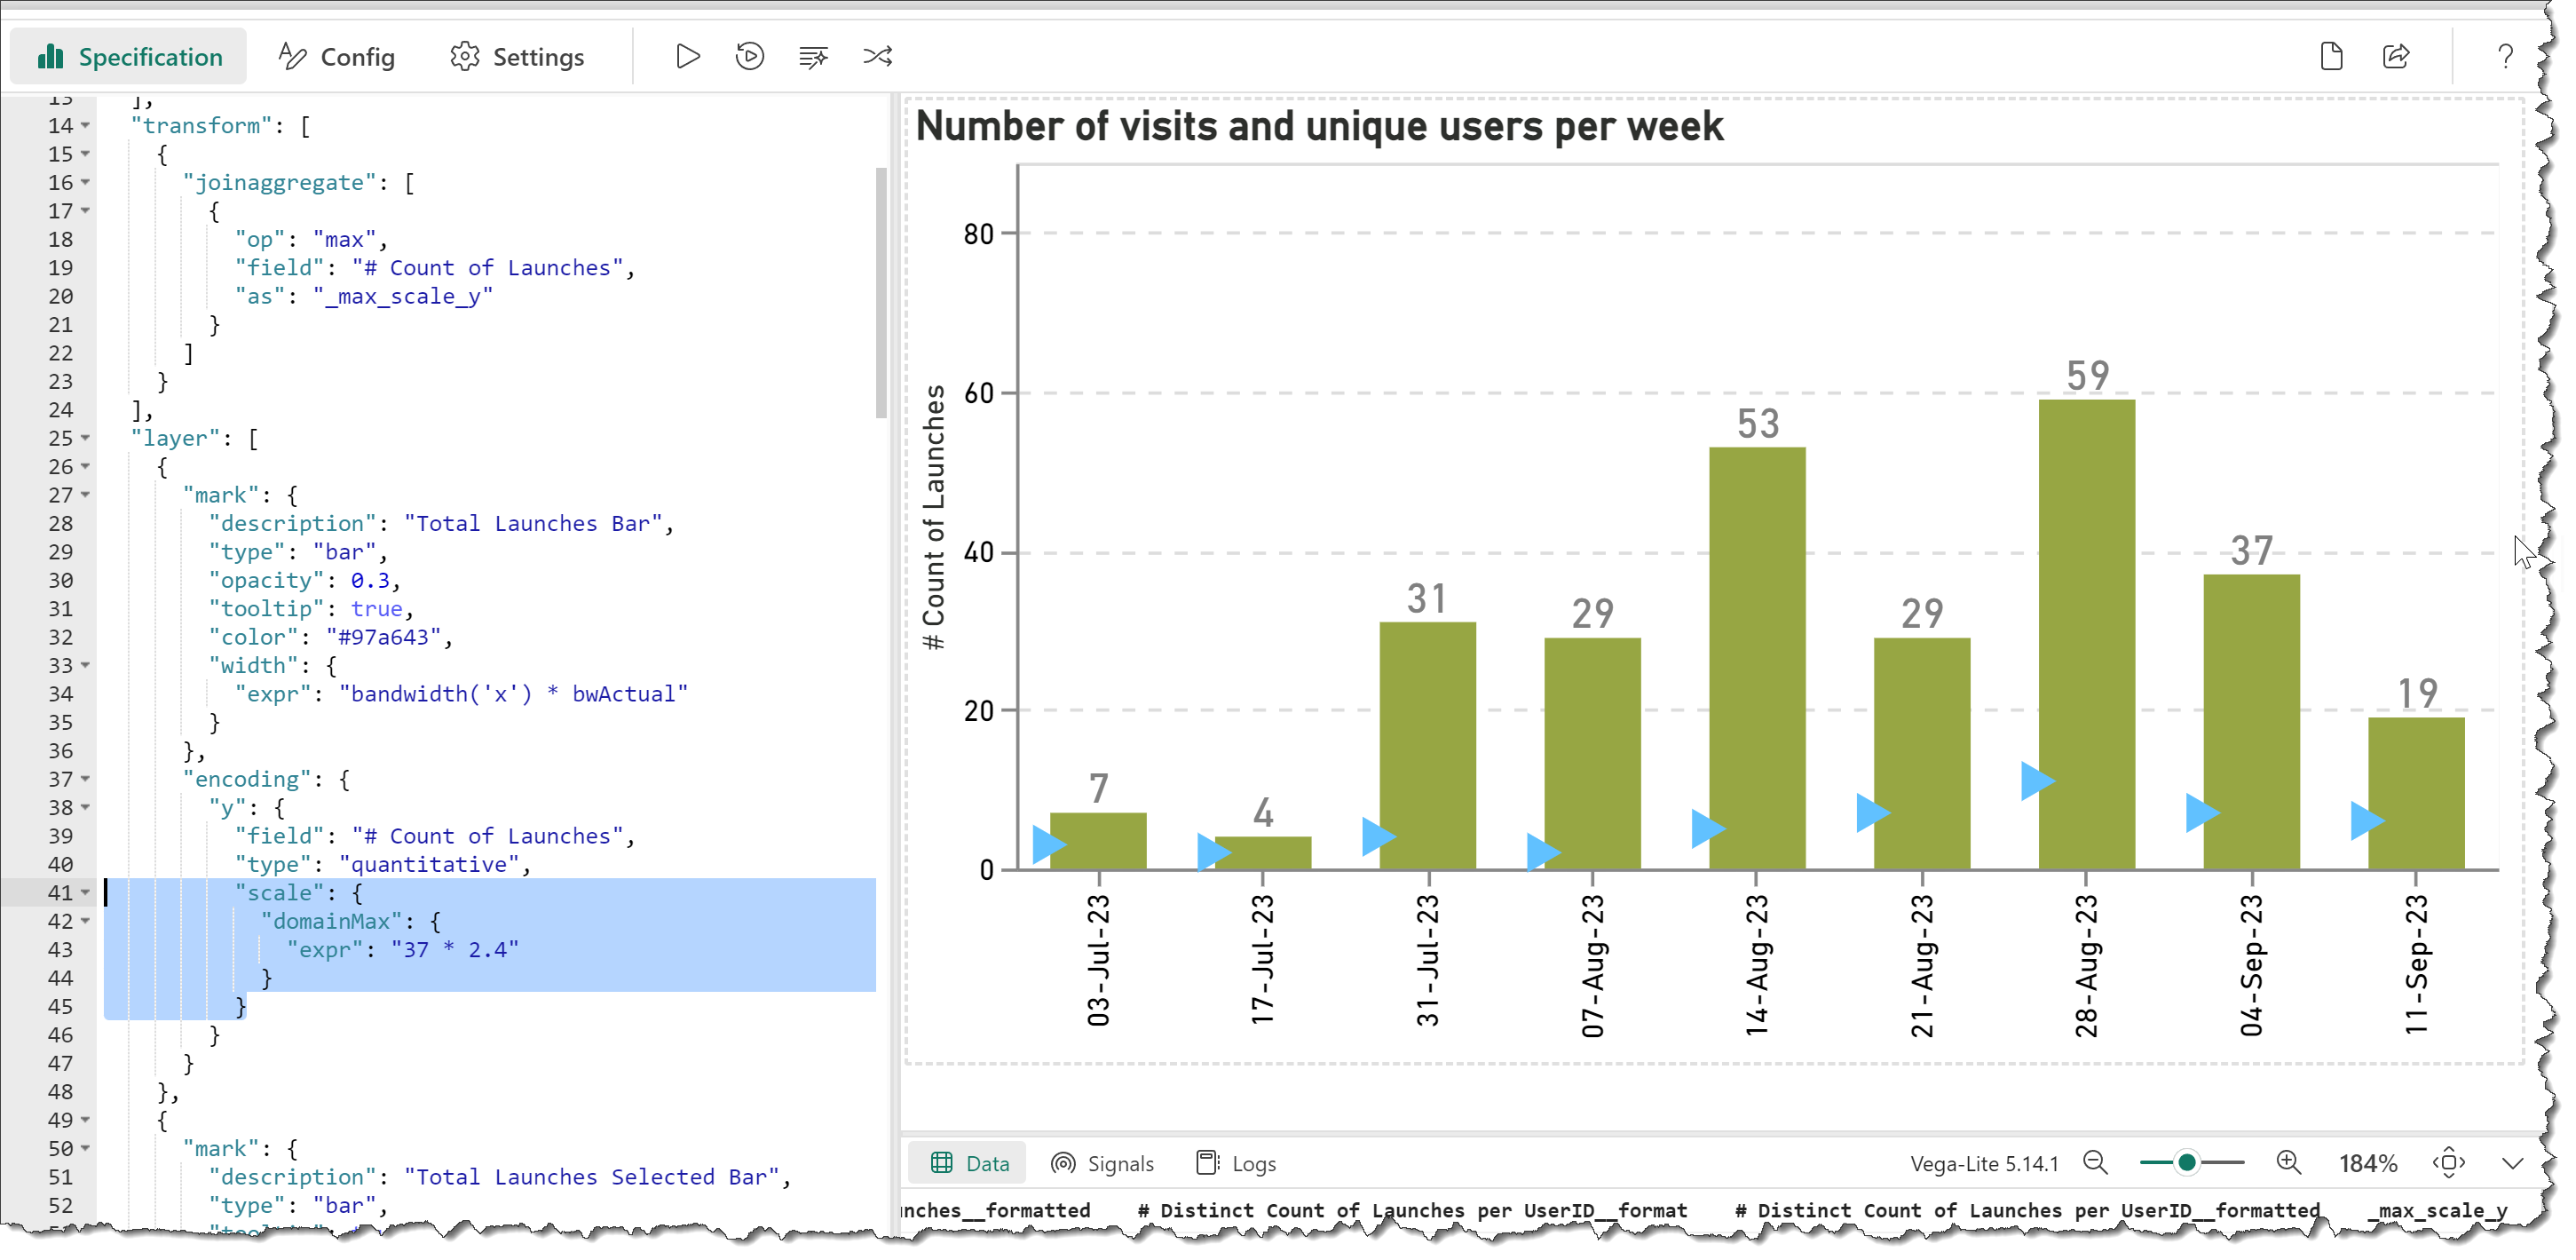
We can debug as follows (note that this won’t work until you remove the erroring domainMax from your spec lower down):

Step 1: Add basic param with pluck of desired field

pluck function doc

{
  ...
  "params": [
    ...
    {"name": "_max_scale_y", "expr": "pluck(data('dataset'), '# Count of Launches')"}
  ],
  ...
}

This gives us all unique values for that field:

image

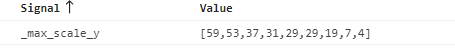
Step 2: Add an extent function

extent function doc

{
  ...
  "params": [
    ...
    {"name": "_max_scale_y", "expr": "extent(pluck(data('dataset'), '# Count of Launches'))"}
  ],
  ...
}

The extent function will give a 2-element array of min/max values from this field:

image

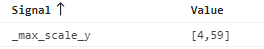
Step 3: Get the max value and multiply

{
  ...
  "params": [
    ...
    {"name": "_max_scale_y", "expr": "extent(pluck(data('dataset'), '# Count of Launches'))[1] * 1.1"}
  ],
  ...
}

We just use an array accessor to get the second entry (as this is 0-based, we use 1 for this). We will then have a number and we can multiply this as needed.

image

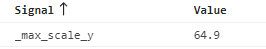
Step 4: Check/restore domainMax

Ensure that this uses your param/signal, e.g.:

{
     ...
      "scale": {
        "domainMax": {
          "expr": "_max_scale_y"
        }
      },
     ...
}

Running your spec will now work as defined, e.g.:

image


You could probably use a better method to scale the max value, but hopefully this will give you ideas to proceed.

Workbook with revised spec attached. Good luck!

DM-P

Reporting Training Support Usage App - eDNA question [DM-P modified].pbix (2.9 MB)

2 Likes

Thanks @dm-p and @DaveC !!!
I read the post by Dave and I realized that the approach I was taking was not correct.
Of course the params approach works perfectly :slight_smile:
Enlarging the domain is important in this example, but it is also fundamental for the charts with brush intervals - making the domain bigger helps to select points. So this method will be well used!

Also I remembered what you told me @dm-p for the axis formatting, and I tested it out for this example:
“domainMax”:{“expr”:“data(‘data_0’)[0][‘_max_scale_y’]*1.1”}
with _max_scale_y defined as joinaggregate as the max of the “# Count of Launches”
it also works - but I do like the params approach better :slight_smile:

So I did learn something new again today - thank you!!!
Kind regards
Valeria

1 Like