Dear Team,
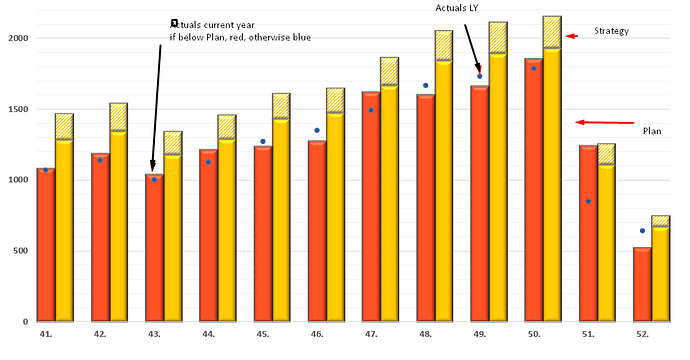
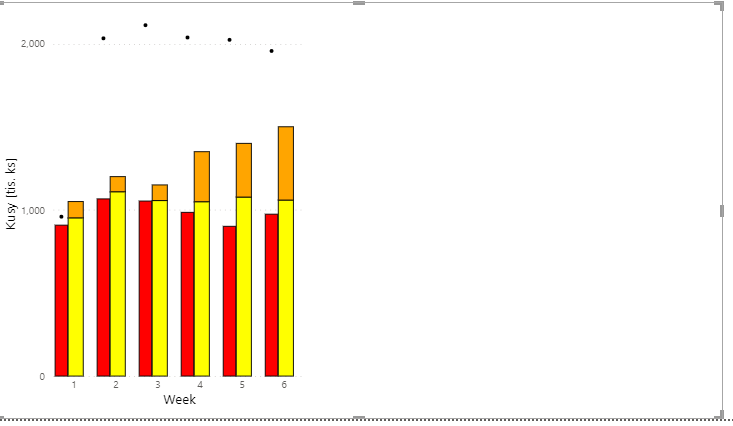
May you kindly advise how to replicate excel chart (attached) using Deneb in PBI. My biggest issue is that I am not able right now to build “strategy” the same way as in excel and also my point for LY actuals are being overlapped by color (red/blue) and I had to move this point a little.
I am sending my attempt in PBI and a screenshot of chart I wish to create using deneb.
Thank you in advance!
Best regards,
Combined Chart Deneb.pbix (1.4 MB)

