Deneb - Clustered Bar Chart / Comparison with Label and Total

Hi,

I have a question about creating clustered bar chart for comparison using deneb.
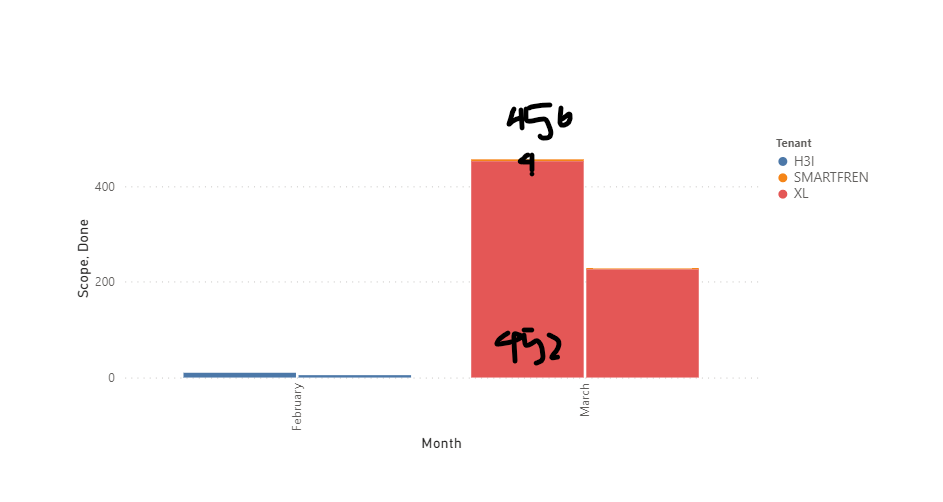
I need to show the label value and total for each chart for example like this:


Kindly need your help for this case.

Thank You,
Yusuf
Question Deneb Add Label in Clustered OR Comparison Chart.pbix (5.5 MB)

Hi @yusufkurniaromadhon.

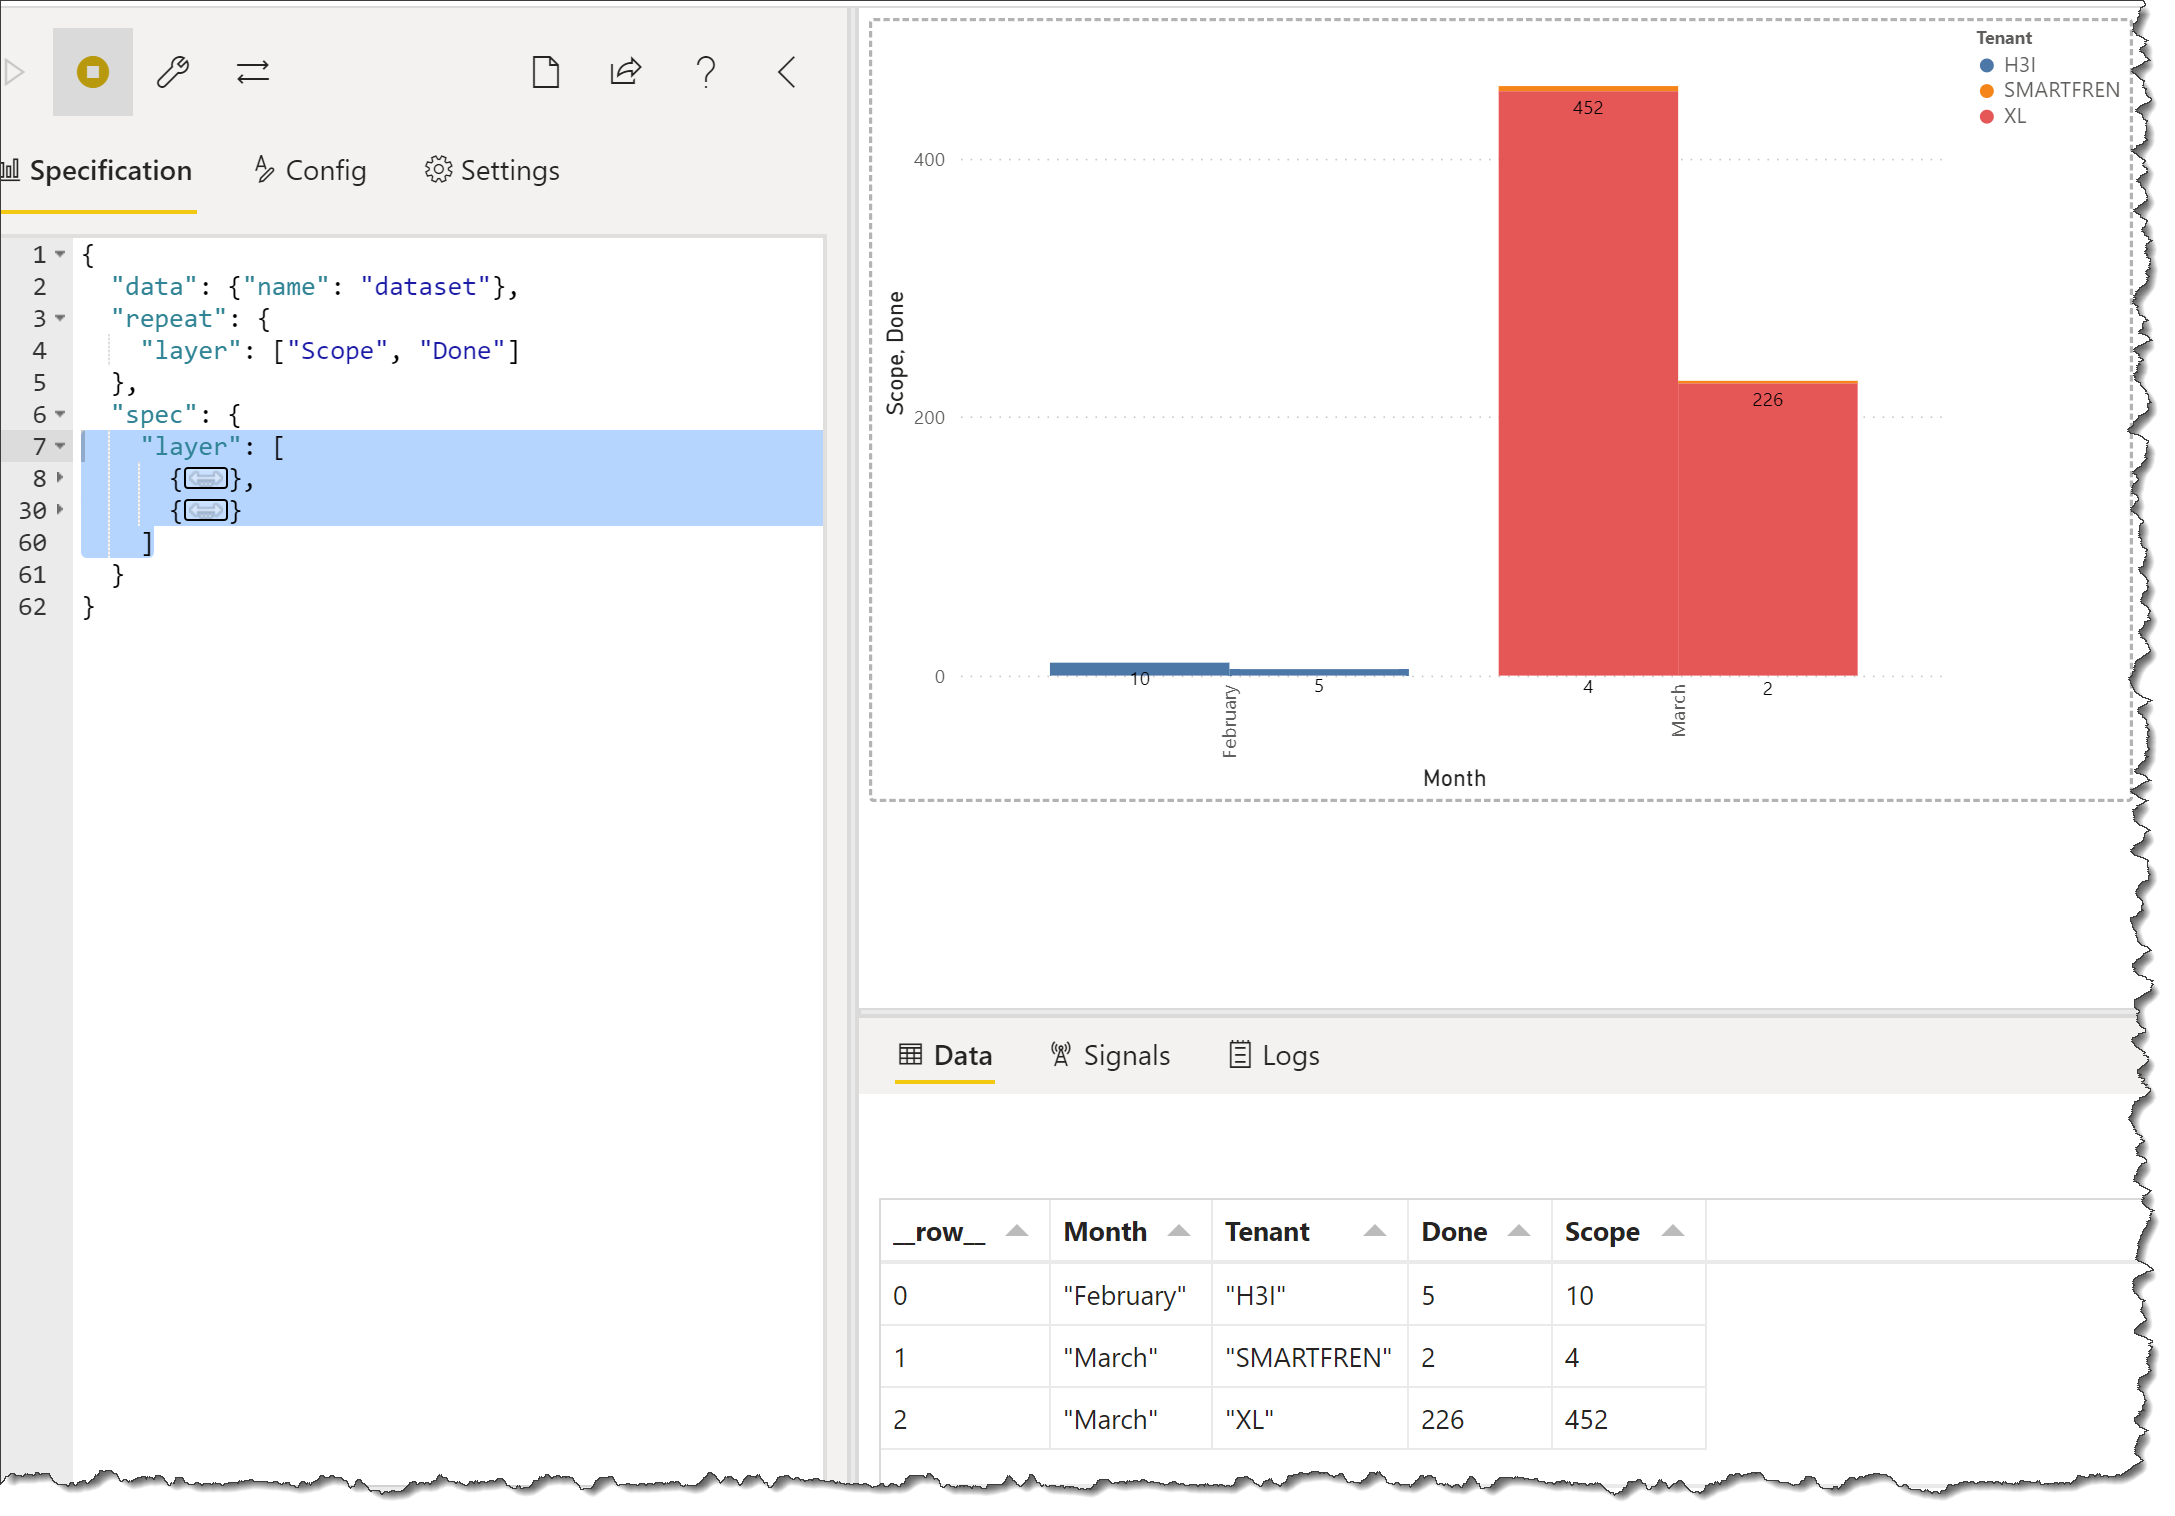
You’ll need 2 different marks in a layer, one for the bar and one for the label. The wide range of the values in your dataset makes a comparison difficult, nevertheless here’s an example:

Here’s the code:

{
  "data": {"name": "dataset"},
  "repeat": {
    "layer": ["Scope", "Done"]
  },
  "spec": {
    "layer": [
      {
        "mark": {
          "type": "bar",
          "tooltip": true
        },
        "encoding": {
          "x": {
            "field": "Month",
            "type": "nominal"
          },
          "xOffset": {
            "datum": {"repeat": "layer"}
          },
          "y": {
            "field": {
              "repeat": "layer"
            },
            "type": "quantitative"
          },
          "color": {"field": "Tenant"}
        }
      },
      {
        "mark": {
          "type": "text",
          "color": "black",
          "yOffset": 10
        },
        "encoding": {
          "text": {
            "field": {
              "repeat": "layer"
            },
            "type": "quantitative",
            "format": "#0",
            "formatType": "pbiFormat"
          },
          "x": {
            "field": "Month",
            "type": "nominal"
          },
          "xOffset": {
            "datum": {"repeat": "layer"}
          },
          "y": {
            "field": {
              "repeat": "layer"
            },
            "type": "quantitative"
          }
        }
      }
    ]
  }
}

Hope it helps.
Greg
eDNA Forum - Deneb Clustered Column Chart Text Labels.pbix (5.5 MB)

1 Like

Hi @Greg

Well noted and thank you.

Regards,
Yusuf