Decile Ranking and grouping question

Hello, Decile Ranking and grouping question

i have created a measure that currently groups customer ID(customers) by spend and they are grouped by customer ID index i established in a supporting table.

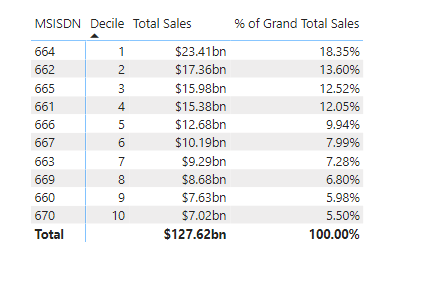
However, Now when i pull the measure into a visual - a matrix for example, I am not sure how to create another measure to group them in the 10 buckets as defined by the supporting table

the following works for the measure to group and rank.
Customer Sales by Group =
CALCULATE([Total Sales],
FILTER(VALUES(‘MSISDN Table’[MSISDN]),
COUNTROWS(
FILTER(‘Grouping Table by Decile2’,
RANKX( ALL(‘MSISDN Table’[MSISDN]),[Total Sales],DESC) > ‘Grouping Table by Decile2’[Low(Min)]
&& RANKX( ALL(‘MSISDN Table’[MSISDN]),[Total Sales],DESC) <= ‘Grouping Table by Decile2’[High(Max)]) )
> 0))

however, i do need to be able to then be able to bring in a measure that segments the results into the groups per the groups table by decile 2 (or deciles 1-10).

any help would be appreciated.
thanks
Jerry

@jerry,

Welcome to the forum – great to have you here!

There are a number of different ways to address your requirement. Here’s one of them that I worked through with a member with a very similar issue:

I hope this is helpful.

  • Brian

P.S. @EnterpriseDNA - Can you please break these two posts off into a separate thread? Thanks.

1 Like

Hello Brian, I really appreciate the response. I actually did try that technique before and tried it again to make sure it at least pulled the right columns, tables & measures.

But, something still is not working in my scenario.

I am wondering if my ask is even possible.

I have one data table and have created a group supporting table(deciles) NOTE: I also have another supporting table that index’s the MSDISDNS but I don’t think it’s necessary). Maybe I can simplify even more in with the following:

I have the following set up.

MSISDN = customer Identification numbers
Each of the columns to the right is transaction types
The Rank index, %, and NEW decile rank is what I have as calculated columns within the data table

***> MSISDN | MOMO_TOTAL_TRAN_COUNT | MOMO_TOTAL_TRANS_AMOUNT ***
224,660,000,000 2 4,000 ***
|TOTAL_TRANS_FEES_AMOUNT
*** 0

> Rank index % New Decile Rank

              44	    0.27%	    10

The ask is how can I create a measure to group the transaction types (any columns in *** above) into the 10 groups(deciles) based on customer spend .

NOTE: the below is the end total result of the Decile ranking per the columns designated above>
Deciles Sales amount
1 51,429,709,973.00
2 13,968,992,534.00
3 10,425,623,510.00
4 8,725,300,523.00
5 8,528,348,209.00
6 8,103,224,691.00
7 7,538,388,251.00
8 6,765,371,555.00
9 6,627,558,067.00
10 5,510,298,755.00
(blank)
Grand Total 127,622,816,068.00

@jerry,

What you want to do should definitely be possible, but without a PBIX to look at your data and data model, it’s difficult to provide additional guidance. If you could please post that when you have a chance, we should be able to assist in providing you a more specific solution.

Thanks.

  • Brian

enclosed is a stripped-down PBIX file(recreated it from actual data). please let me know if you have any further suggestions.
thanks
JerrysampleJGData.pbix (960.0 KB)

@jerry,

Is this the end result you’re looking for?

image

If so, I’ve fixed your measures per the solution file attached to calculate them properly per above. However, I had a hard time figuring out what you are trying to do with the calculated columns in your fact table. For this sort of analysis, you should use measures rather than calculated columns for a couple of reasons:

  1. doing rankings and decile calculations on a row by row basis doesn’t make logical sense, since you need to aggregate transactions by client before ranking or calculating deciles

  2. for these sorts of calculations, you typically want them to be wholly dynamic, so that you can slice by date, customer, etc. and still have the correct results display in your visualizations. That won’t be possible using calculated columns, since those only recalculate upon load or refresh.

If I’ve misinterpreted your requirement, please let me know and we can make the necessary changes to the solution.

I hope this is helpful. Full solution file attached below.

Hello Brian,
thank you for this. This is not quite the result I was looking for. I think your explanation of doing a row by row analysis is validating my conclusion as well. And that is, as you say, it does NOT make sense to try to DECILE rows then segment the columns.

The end goal is trying to provide a visual to the various business units of cross-selling or up-selling opportunities. In the EDNA example for this, its only a recording so I could not drill into the DAX pattern. But either way, as you put it, it does look like trying to decile, and segment needs to be done by customer aggregation first. or the source data maybe needs to be extracted differently? But that may not make sense either way.

any additional thoughts?
thanks so much for your help
Jerry

@jerry,

Sure – glad to help. If you can provide a mockup of the result you’re looking for (perhaps in Excel), I’m confident we can work out the DAX to get there.

  • Brian

Hi @jerry, we’ve noticed that no response has been received from you since the 2nd of May. We just want to check if you still need further help with this post? In case there won’t be any activity on it in the next few days, we’ll be tagging this post as Solved. If you have a follow question or concern related to this topic, please remove the Solution tag first by clicking the three dots beside Reply and then untick the checkbox. Thanks!