Debt Recovery Modeling using What if Parameters - Assistance required to improve performance of DAX Measures

Hi,

I am attempting to model recovery of outstanding debts based on a number of factors:

  1. projected recovery amount of each debt type
  2. projected payment timeframe of each debtor
  3. start date of the debt recovery project
  4. the ranking order in which the recovery of debts should be actioned
  5. what if parameters for:
  • Recovery Cost per hour
  • Average Hrs Effort per debt
  • Number of staff allocated to the debt recovery project.

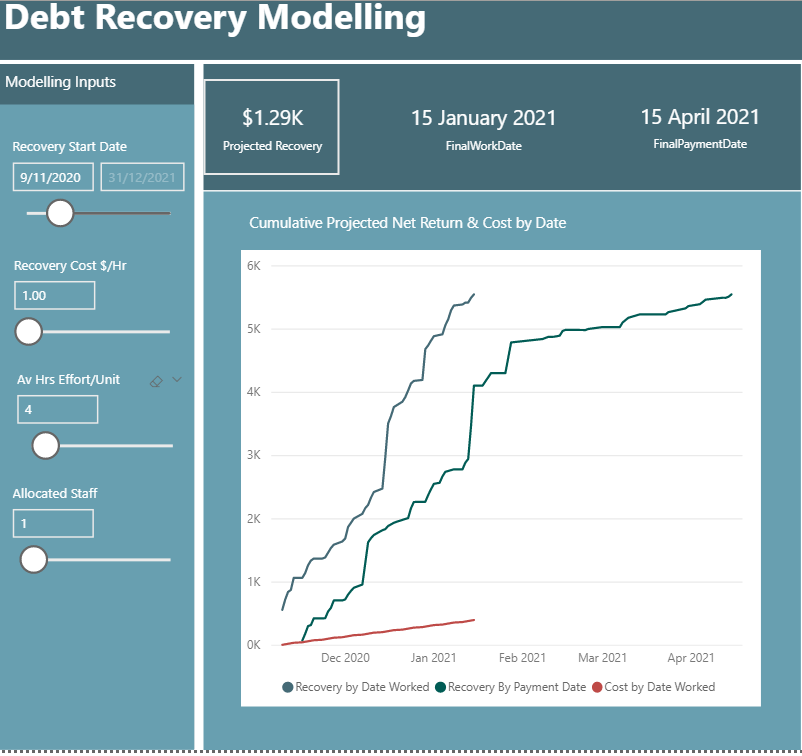
I am able to generate the desired visual with my test record set which contains 100 records.
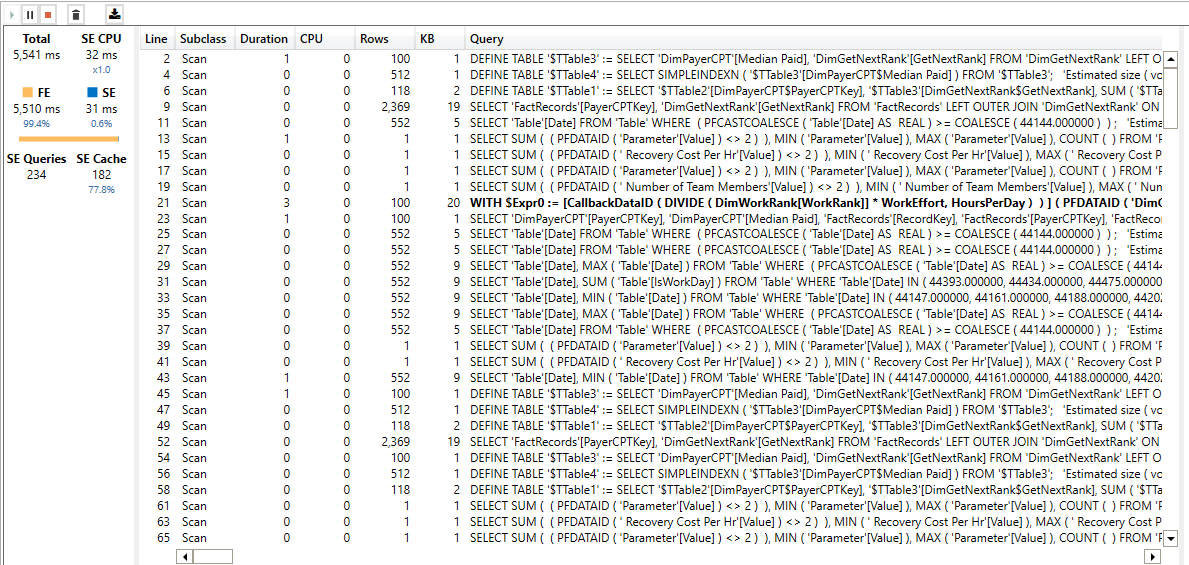
However when attempting to use my actual record set of > 100K records, the visual exceeds the available resources.

I would really appreciate some guidance on how to improve my DAX measures for faster performance.
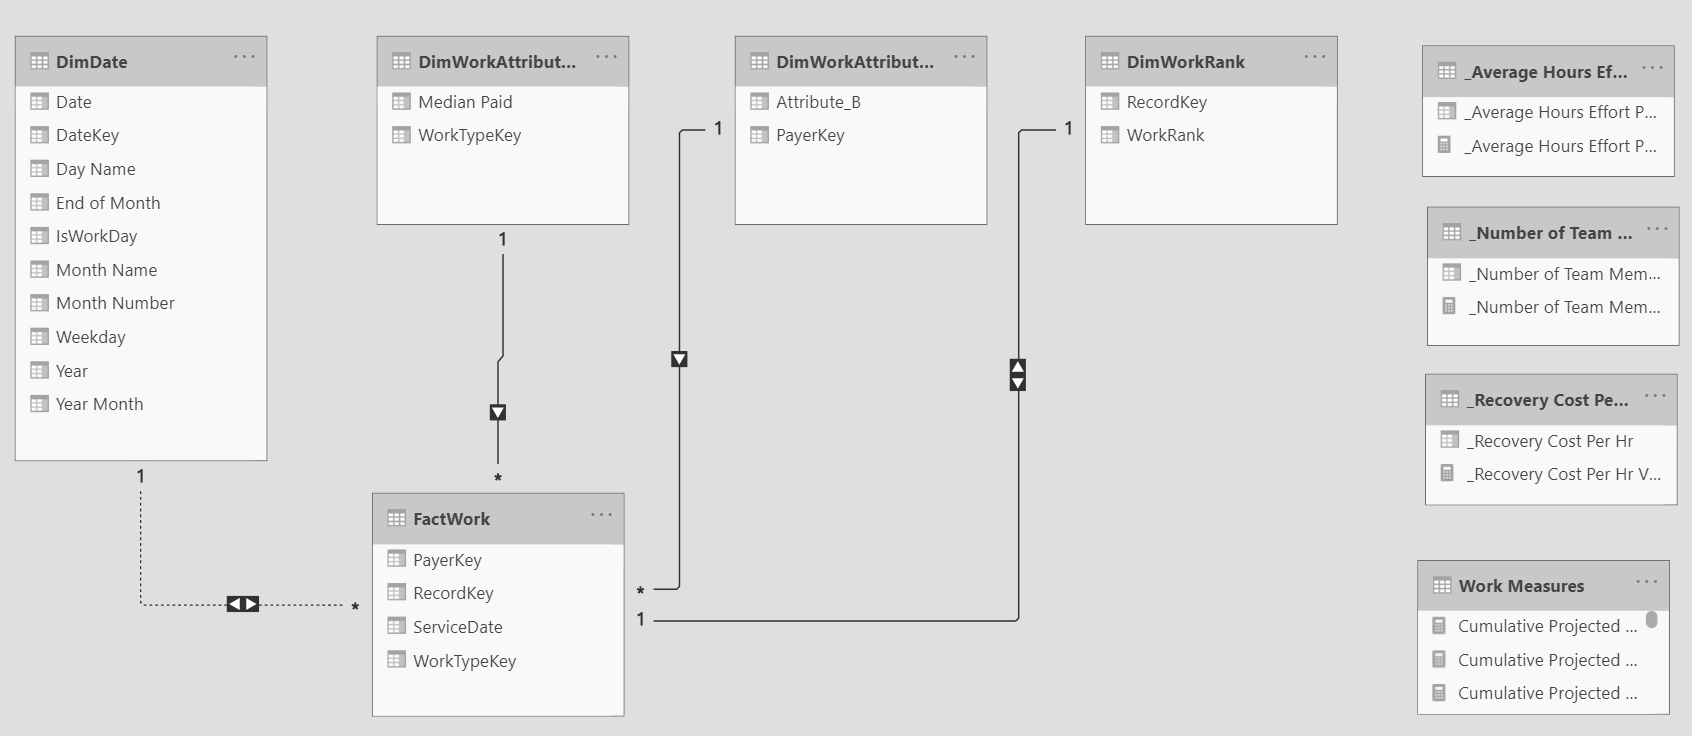
It is my understanding that I cannot leverage calculated columns due to the use of what if parameters in the model.

Below are the DAX measures upon which the Cumulative Recovery by Date Worked measure in the line chart visual relies. I have also attached the pbix file.

Many thanks in advance
Jo.

Total Paid = 
CALCULATE( SUM( DimWorkAttribute_A[Median Paid] ),
            TREATAS( VALUES(FactWork[WorkTypeKey] ), DimWorkAttribute_A[WorkTypeKey] )
)

Recovery Cost Per Work Unit = 
IF( ISBLANK( [Total Paid] ),
    BLANK(),
    [_Average Hours Effort Per Work Unit Value] * [_Recovery Cost Per Hr Value]
)

Projected Recovery = 
[Total Paid] - [Recovery Cost Per Work Unit]

Total Hrs Effort Per Work Day = 
VAR FTEHrsPerDay = 8
VAR AllocatedFTEResources = [_Number of Team Members Value]
VAR TotalEffortPerDay = FTEHrsPerDay * AllocatedFTEResources 
RETURN
TotalEffortPerDay

Work Item Number Of Work Days From Start = 
VAR WorkEffort = [_Average Hours Effort Per Work Unit Value] 
VAR HoursPerDay = [Total Hrs Effort Per Work Day]
VAR WorkDayNumber = ROUNDUP( 
                        MAXX( DimWorkRank, 
                            DIVIDE( DimWorkRank[WorkRank] * WorkEffort, HoursPerDay ) 
                        ),
                        0
                )
RETURN 
WorkDayNumber

Cumulative Work Days = 
VAR CurrentWorkDate = MAX( DimDate[Date] )
VAR DateFilter = FILTER ( 
                         ALLSELECTED( DimDate ),
                         DimDate[Date] <= CurrentWorkDate ) 
RETURN
CALCULATE( SUM( DimDate[IsWorkDay] ), 
            DateFilter 
)

Projected Date to Start Work Unit = 
VAR ProjectDates = ALLSELECTED( DimDate )
VAR ProjectedWorkStartDate = CALCULATE(
                                    MIN( DimDate[Date] ),
                                    FILTER( ProjectDates,
                                    [Cumulative Work Days] = [Work Item Number Of Work Days From Start]
                                    )
                            )
RETURN 
IF( ISBLANK( [Work Item Number Of Work Days From Start] ),
    BLANK(),
    ProjectedWorkStartDate
)

Projected Recovery by Date Worked = 
VAR WorkDate = SUMMARIZE( DimWorkRank, DimWorkRank[WorkRank], "ProjectedRecovery", [Projected Recovery], "WorkDate", [Projected Date to Start Work Unit] )
VAR DateTable = SUMMARIZE( DimDate, DimDate[Date], "WorkDate", MAX( DimDate[Date] ) )
VAR SummaryTable = NATURALINNERJOIN( DateTable, WorkDate ) 
RETURN
SUMX( SummaryTable, [ProjectedRecovery] )

Cumulative Projected Recovery by Date Worked = 
VAR CurrentDate = MAX( DimDate[Date] )
VAR DateFilter = FILTER( ALLSELECTED(DimDate), DimDate[Date] <= CurrentDate )
RETURN
IF( ISBLANK( [Projected Recovery by Date Worked] ),
    BLANK(),
    CALCULATE( [Projected Recovery by Date Worked], DateFilter )
)

Dynamic Timeframe Debt Recovery.pbix (133.3 KB)

@jo_clifford I was able to reduce the total time from 5.6 seconds to 1.5 seconds, now it will run faster with even more data. Dynamic Timeframe Debt Recovery.pbix (147.7 KB)

Queries produced with my code:

Queries produced by your code:

If I spend more time I can optimize even further but will see if that’s even required or not, because 1.5 second is the time of whole report and not of any individual code so it is pretty fast.

5 Likes

@jo_clifford Now it is twice as fast, query time dropped to 742 ms, created a base table that is used in most queries, optimized cards, and removed bottlenecks, reduced Storage engine queries.
Dynamic Timeframe Debt Recovery.pbix (138.9 KB)

4 Likes

@AntrikshSharma
Amazing work :clap: :clap:

2 Likes

@MudassirAli Only If I knew what those measures actually compute and mean, I could go even further… :stuck_out_tongue: So far I have only used my DAX knowledge, I think now that everything is optimized by a magnitude he can work on data model and best practices.

3 Likes

Excellent job @AntrikshSharma! I had some success by treating the entire thing as a single measure and a second table for the legend, but after I saw your post I took your code and replaced my variables with yours. Expanding on your measures, by treating it as a single measure improved the speed down to 0.7 seconds when I tested it:

Dynamic Timeframe Debt Recovery.pbix (147.5 KB)

Debt Recover Model =
VAR CurrentDate = MAX ( DimDate[Date] )
VAR ProjRecByDateWorkedTemp =
ADDCOLUMNS (
ALLSELECTED ( DimDate ),
“@Projct Recovery Total”, [Projected Recovery by Date Worked]
)
VAR ProjRecByDateWorkedResult =
SUMX (
FILTER (
ProjRecByDateWorkedTemp,
DimDate[Date] <= CurrentDate
),
[@Projct Recovery Total]
)
VAR ProjRecByDateWorked = IF ( NOT ISBLANK ( [Projected Recovery by Date Worked] ), ProjRecByDateWorkedResult )

VAR CumProjRecByProjPayDateTemp =
ADDCOLUMNS (
ALLSELECTED ( DimDate ),
“@Projct Recovery Total”, [Projected Recovery by Projected Payment Date]
)
VAR CumProjRecByProjPayDateResult =
SUMX (
FILTER (
CumProjRecByProjPayDateTemp,
DimDate[Date] <= CurrentDate
),
[@Projct Recovery Total]
)
VAR CumProjRecByProjPayDate = IF ( NOT ISBLANK ( [Projected Recovery by Projected Payment Date] ), CumProjRecByProjPayDateResult )

VAR CumProjRecCostByDateWorkedTemp =
ADDCOLUMNS (
ALLSELECTED ( DimDate ),
“@Projct Recovery Total”, [Projected Recovery Cost by Date Worked]
)
VAR CumProjRecCostByDateWorkedResult =
SUMX (
FILTER (
CumProjRecCostByDateWorkedTemp,
DimDate[Date] <= CurrentDate
),
[@Projct Recovery Total]
)
VAR CumProjRecCostByDateWorked = IF ( NOT ISBLANK ( [Projected Recovery Cost by Date Worked] ), CumProjRecCostByDateWorkedResult )

RETURN
SWITCH(
MAX(DebtRecoverModel[Order]),
1, IF ( NOT ISBLANK ( [Projected Recovery by Date Worked] ), ProjRecByDateWorked ),
2, IF ( NOT ISBLANK ( [Projected Recovery by Projected Payment Date] ), CumProjRecByProjPayDate ),
3, IF ( NOT ISBLANK ( [Projected Recovery Cost by Date Worked] ), CumProjRecCostByDateWorked ),
BLANK()
)

3 Likes

@AntrikshSharma I am completely in awe of your solution and indebted to you!
This is amazing work - I am going to apply it to my actual model now.
My CEO is going to be ecstatic that we can finally present these visuals.
I’ll let you know how it goes with the actual record set :slight_smile:

4 Likes

@jo_clifford Sure, let us know how it goes.

Hi @AntrikshSharma and @bradsmith,
by using a combination of your suggested DAX and some of my original DAX the publish version of the full report is now displaying in under 20 seconds :grinning:
Thankyou both for taking the time to reply to my post and resolve the issues.
It has been a steep DAX learning curve these past few months - your advice has helped me immensely and inspired me to keep looking for better solutions :clap:

2 Likes

@jo_clifford Great. 20 Seconds is still a lot, What is the file size with that data? If you could share the file I would like to see what cause the delay.

1 Like