Hi @Thimios ,
Interesting questions, compare sales values with LY and analysis of sales differences.
Please receive hereby a solution, with the following steps:
- Slight adjustment data model
- Sales, quantity and average price calculation by creating measures (see group “DS Measures”)
- Sales, quantity and average price calculation previous year with help of the “DateAdd”-function and measure branching
- Setting up price and quantity variations to analyze the sales variances, based upon Price impact (AvPrice - LY AvPrice) * Qty) and Qty impact ((Qty - LY Qty) * LY AvPrice)
- Base setup of an analysis report, which can be used regardless chosen products or time periods.
The solution is an extension of one of the videos of Sam McKay, which clearly explains time comparisons in combination with measure branching, titled "This Year vs Last Year Time Comparisons & Differences In Power BI " , https://www.youtube.com/watch?v=nrjJuNbzKRA
Workout explained:
PBIX with solution attached:
TestES (v2).pbix (37.6 MB)
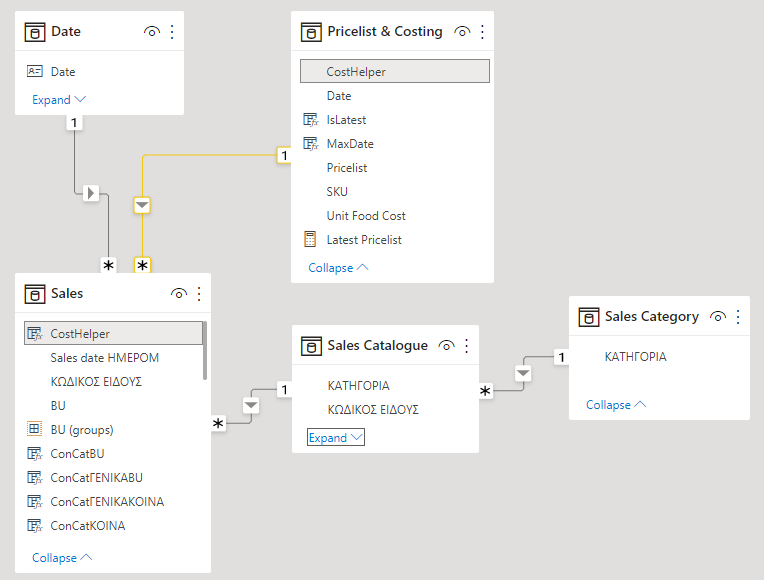
1. Slight adjustment data model, use “CostHelper” as the key for sales price information.
-
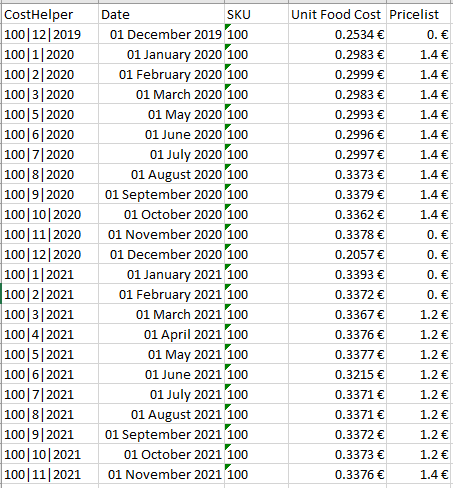
“Pricelist & Costing” is the base for the sales price, with an unique key “Costhelper”, which combines the product code with a starting date period of the price (in this table multiple-sales prices per product are stored, each with an unique key “Costhelper” (some prices are missing)
-
“Sales Catalogue” can be used to distinguish Product characteristics in reports
-
“Date” is used to distinguish different periods and to calculate previous year (and/or other periods)
2. Sales, quantity and average price calculation measures, in group “DS Measures”
 Sales revenue = SUMX( Sales, Sales[ΠΟΣΟΤΗΤΑ QTY] * RELATED('Pricelist & Costing'[Pricelist]))
 Sales Qty = SUM(Sales[ΠΟΣΟΤΗΤΑ QTY])`
 Sales avg price = DIVIDE( [Sales revenue], [Sales Qty],0)  // measure branching
3. Sales, quantity and average price calculation previous year with help of the “DateAdd”-function and measure branching (instead of “YEAR” in DateAdd, other periods can be chosen.)
LY Sales revenue = CALCULATE( [Sales revenue], DATEADD('Date'[Date], -1, YEAR))
LY Sales Qty = CALCULATE( [Sales Qty], DATEADD('Date'[Date], -1, YEAR))
LY Sales avg price = CALCULATE( [Sales avg price], DATEADD('Date'[Date],-1,YEAR))
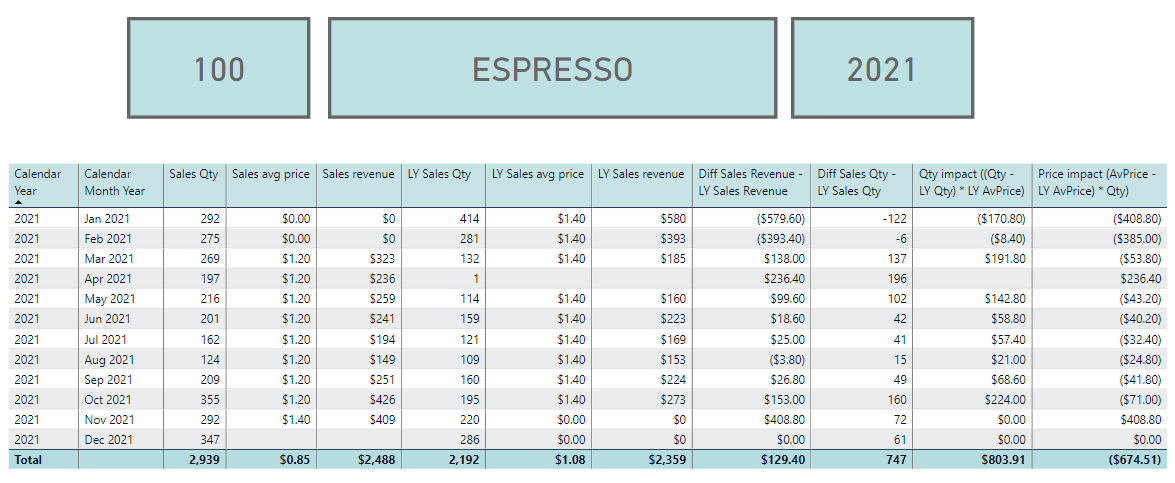
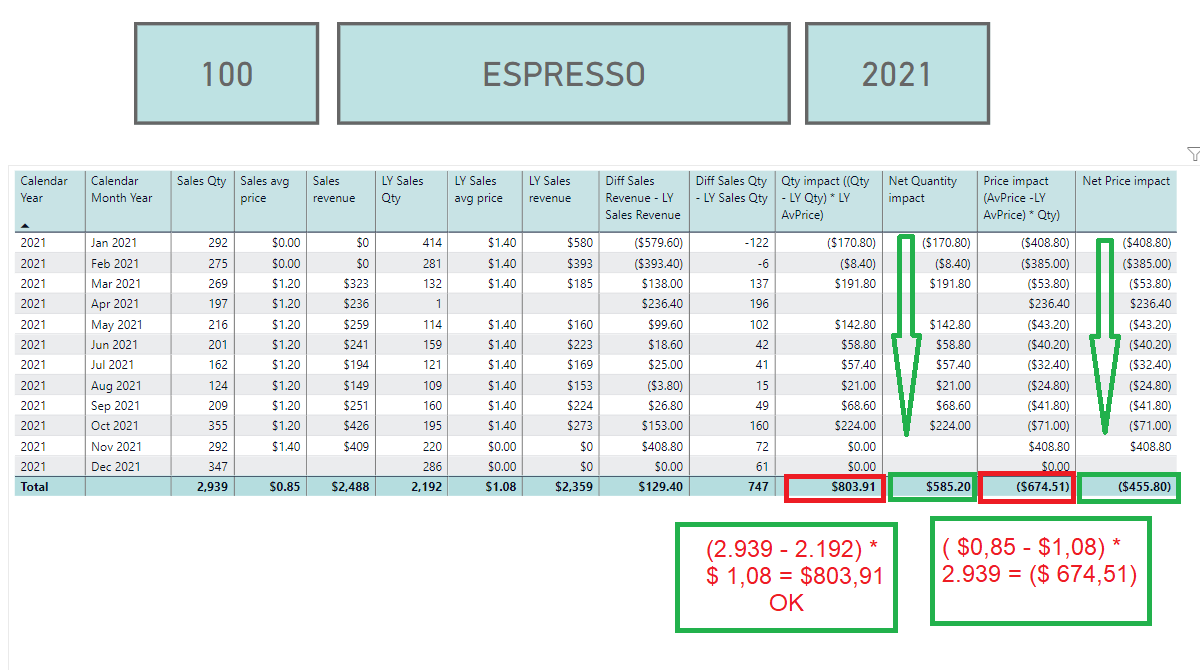
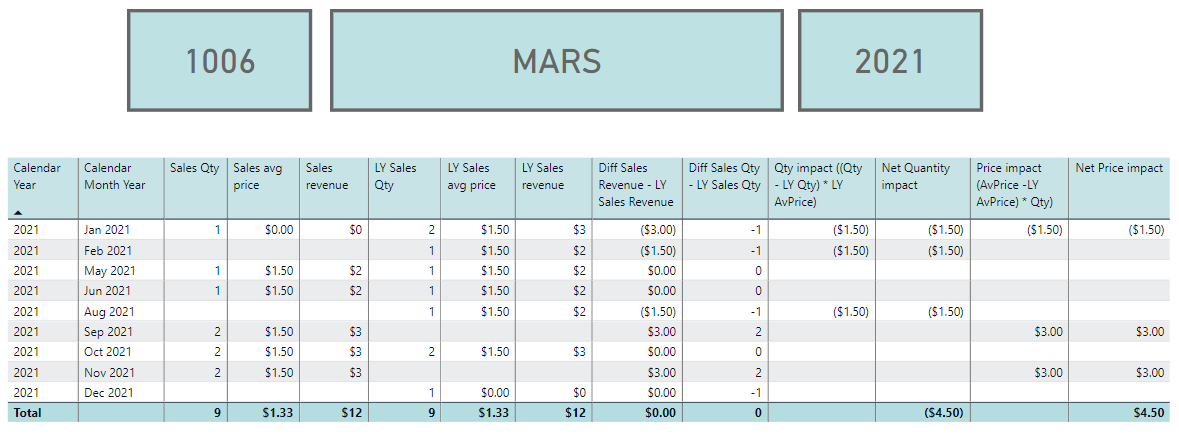
4. Setting up price and quantity variations to analyze the sales variances, with calculations, based upon Price impact (AvPrice - LY AvPrice) * Qty) and Qty impact ((Qty - LY Qty) * LY AvPrice), all set up with measure branching 
Those formulas work for all selected (aggregations of) time periods and products.
Diff Sales Revenue - LY Sales Revenue = [Sales revenue] - [LY Sales revenue]
Diff Sales Qty - LY Sales Qty = [Sales Qty] - [LY Sales Qty]
Qty impact ((Qty - LY Qty) * LY AvPrice) = ([Sales Qty] -[LY Sales Qty]) * [LY Sales avg price]
Price impact (AvPrice -LY AvPrice) * Qty) = ([Sales avg price] - [LY Sales avg price]) *[Sales Qty]
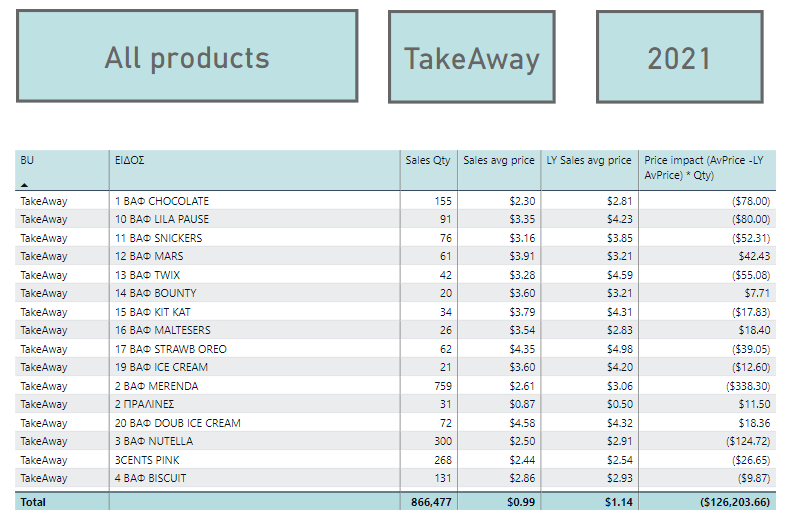
5. Base setup of an analysis report
Can be used for all chosen (groups of) products and time periods. See page “sales analysis”.
This appears to be a nice example of the power of measure branching.
I hope this answers your requirements, if you have further questions or remarks, please let me know.
Kind regards, Jan van der Wind