Hi,
I am new to PowerBI and watched a lot of videos to learn in the past couple of weeks. Currently I try to create a report to show the Days on Hand of Rawmaterial (Level2 of the BOM) based on a forecast of Finish Good.
My Scenario: I sell different burgers (=FinishGood). Each burger has one or two different sauces (=Sub1). Each sauce has different ingredients (Sub2). I need to see when I run out of my ingredients and how many days on hand for each sub2 is available.
If I do not have enough sub2 items available, I need to allocate the sub2 based on the needs from Marketing and therefore also calculate a % of how much can I produce for one type of sauce in a specific week.
My ideas is as follow:
I take the current stock level, any further planned arrivals of each sub2 item and the demand for each week to calculate a running total of my balance for each Sub2 Item per week. Then I look when this running total is negativ and calculate the days from current week to the date of the negative running total. If there is no negative value, so no issue in supply, I divide my running by the average weekly usage to still get a DOH value.
The formula is working. Took me a long time to work it out but I am really happy about it.
My issue now is the transfer the sample data to real data. Real data has several locations (plants), and forecast rows in fact table is around 200k rows.
In this scenario the speed is not good, sometimes aroud 30 secs. for refreshing the visuals. I run the Dax Studio Analysis and I can see that the Formula Engine is slow, but I do not know why.
Does anyone has an idea why it is so slow.
The main issues I found is the formula for measuer “Sub2 DOH” and “Sub2 vs. Demand % Based Stock this Week”.
I would suggest that you install Tabular Editor, DAX Studio, VertiPaq Analyzer (External Tools) and run the Performance Analyzer (internal option available within Power BI). This should point out obvious issues you can address that can reduce the size of your data model as well as help you identify the issues with load/refresh time of each object within the report.
My findings:
I noticed 144 BP issues when I ran the Best Practice Analyzer on your file.
Of the total 36 columns, 15 columns are not referenced within the model. You might want to check on these and probably remove them from the model if not required and remove them early in the data transformation process too.
You seem to have created Calculated Tables within the model. Would it be possible to create these tables within Power Query rather than in DAX?
Replace the Date Calendar Calculated columns you have created using DAX with the equivalent column in M Language.
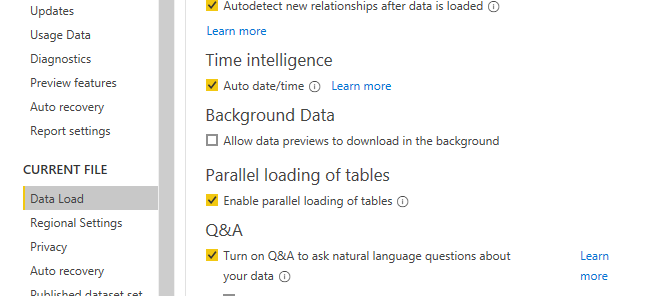
Disable the Auto/Date Time Option from your Power BI file by unchecking it under Options → Current FIle → Data Load → Time Intelligence.. Currently this option is checked and hence there is a hidden calendar table created in the background.
Also, from a speed perspective, is it the refresh time, load time or transition time that you have issues with?
If it is data refresh time, you can use Best Practice Analyzer from within Tabular Editor to identify and fix issues.
If it is load time or transition time, it is most likely the objects on your page, you can use “Performance Analyzer” under View to identify the object of DAX responsible for the sluggishness.
Hi, thanks for the feedback. I did install the tabulator editor now and had a look. Most of the best practice are naming issues like camelnameing and some columns I do not use.
In the dax editor I can see that some formulas do have a lot of SE Query and the formulas
E.g. the measure “Sub2 vs. Demand % Based Stock this Week” has more then 60 querys and I do not know how to reduce them.
Anyway, I was playing with some transformation and creating a kind of spotlight table for the stock in pq. This seems to be fine but still checking.
overall, I know my measures are working, just crazy slow in my opinion.
So yes, its the load time for the objects in the report
Hi @Klaus, due to inactivity, a response on this post has been tagged as “Solution”. If you have a follow question or concern related to this topic, please remove the Solution tag first by clicking the three dots beside Reply and then untick the check box.