DAX Workout 023 - Calculating Simple Running Sums

Everyone,

Welcome to the next workout. This one is going to be similar to Workout 019, but I decided to simplify this one a bit. Workout 019 was more focused on creating an area chart where this one gets back to simply creating running totals.

And - this is a great workout if you are new to DAX.

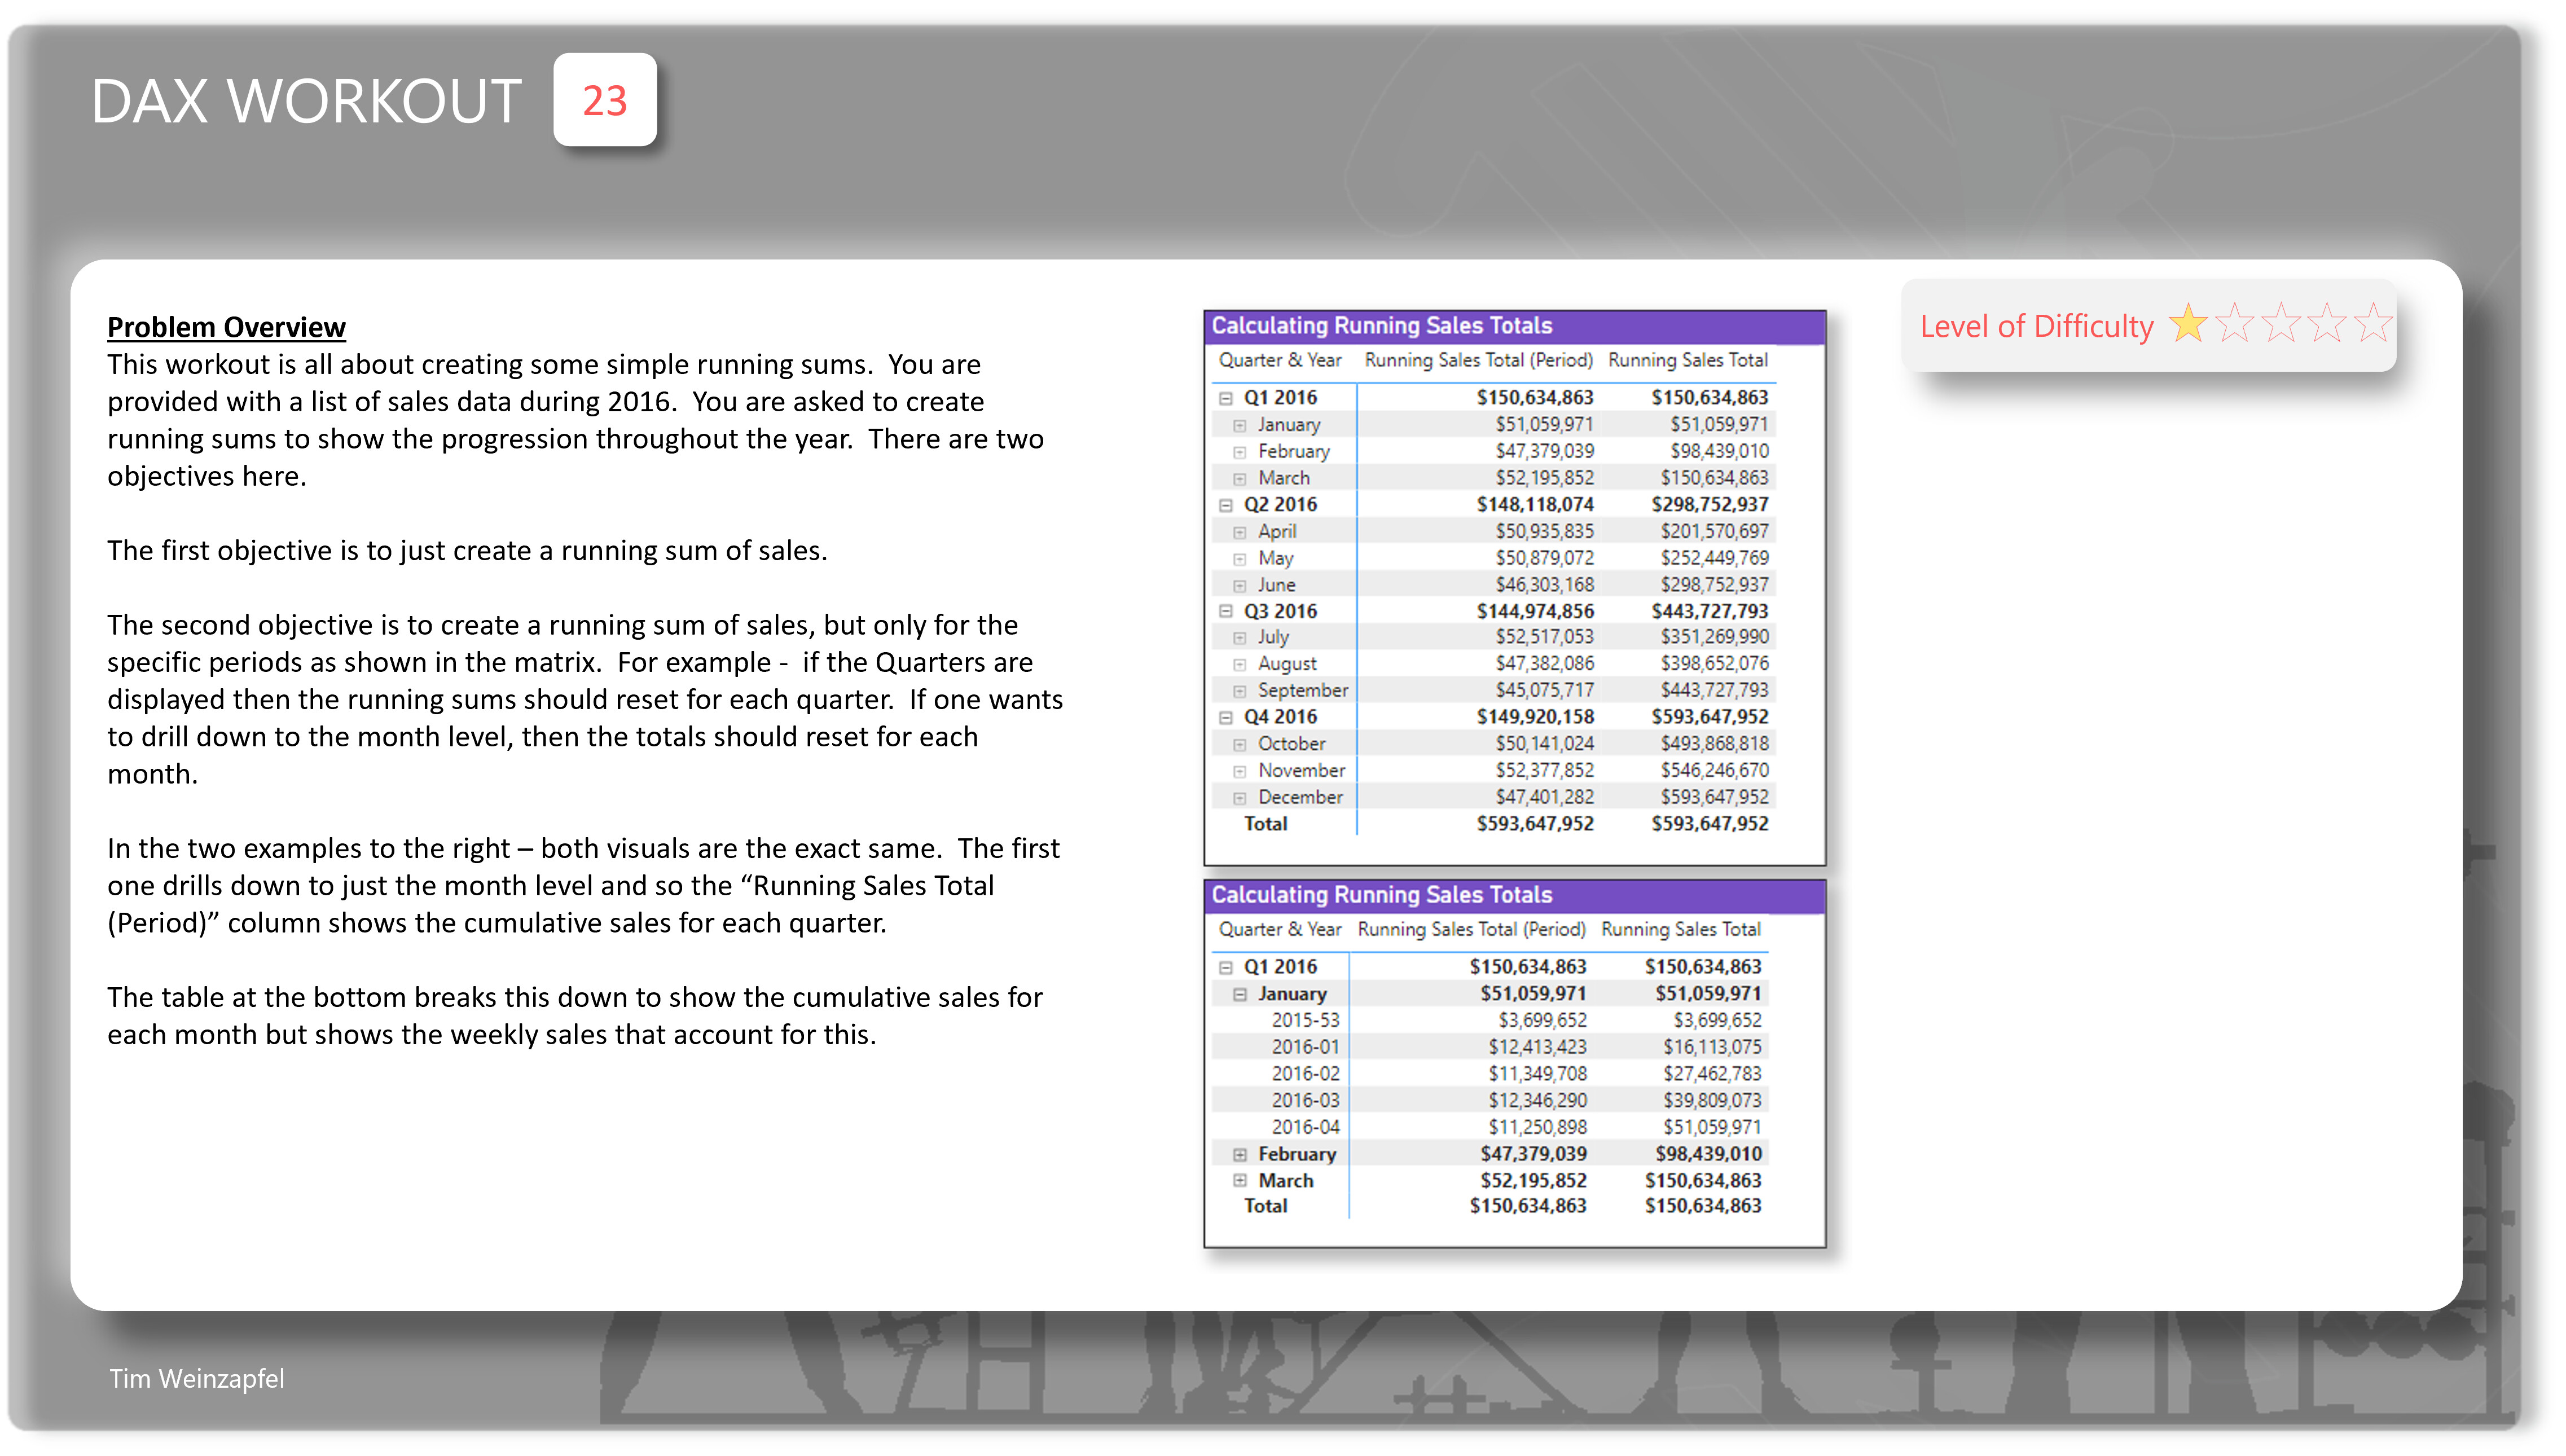
In this workout you are provided a dataset of sales during 2016. The ask here is simple.

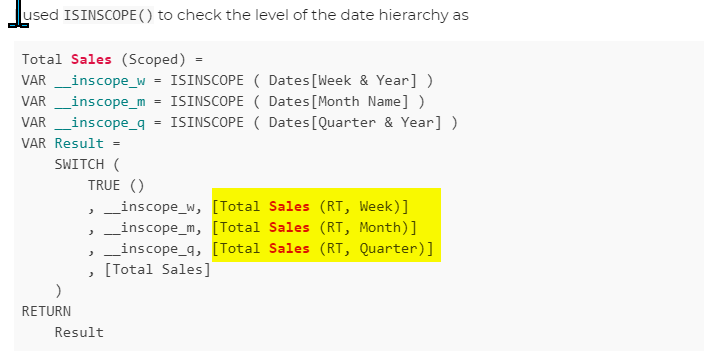
First - creating a measure that calculates the running total.

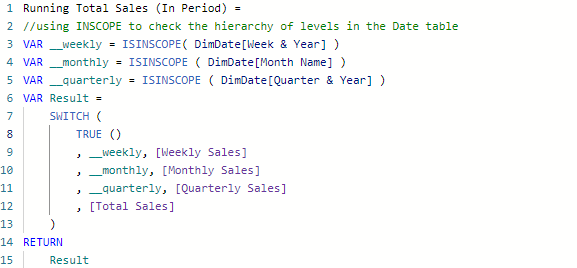
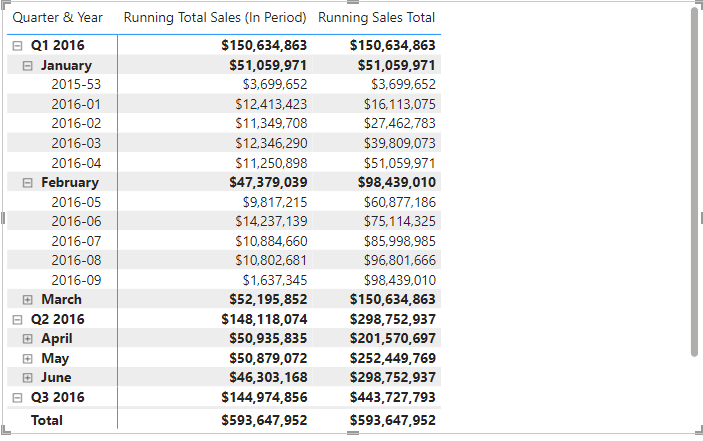
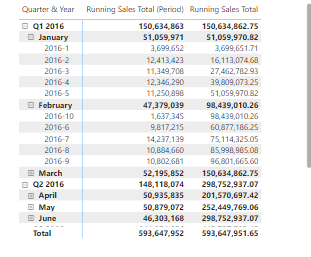
The second objective is create another measure that will create the running total - but only for the periods shown in a matrix. For example in the matrix shown - the first column (Running Sales Total (Period)" will show the running total at the Quarter or Month level depending on whether the user drills up/down.

Here is the data file to use:
Workout 023 Data.xlsx (67.5 KB)

Submission
Load the supplied data file, create your solution, and reply to this post. Upload a screenshot of your solution (or the PBI file) along with any DAX items. Please blur any solution or place it in a hidden section.

@tweinzapfel,

I used ISINSCOPE() to check the level of the date hierarchy as

Total Sales (Scoped) = 
VAR __inscope_w = ISINSCOPE ( Dates[Week & Year] )
VAR __inscope_m = ISINSCOPE ( Dates[Month Name] )
VAR __inscope_q = ISINSCOPE ( Dates[Quarter & Year] )
VAR Result =
    SWITCH (
        TRUE ()
        , __inscope_w, [Total Sales (RT, Week)]
        , __inscope_m, [Total Sales (RT, Month)]
        , __inscope_q, [Total Sales (RT, Quarter)]
        , [Total Sales]
    )
RETURN
    Result

to conditionally select the appropriate running total measure based on date-level visibility in the visual.

gif

@tweinzapfel thanks for the workout and below is my submission. I also used same pattern as @HufferD

DAX Code

Summary

DAX Code_Workout023Eze

@HufferD Can you provide the measures that you used here? Just want to understand the different techniques as compared to mine. Thanks

Certainly. And my apologies as i should have added those to my post:

Total Sales (RT, Week) = 
CALCULATE(
	[Total Sales]
    , FILTER(
		CALCULATETABLE(
			SUMMARIZE(
                'Dates'
                , 'Dates'[WeeknYear]
                , 'Dates'[Week & Year]
            )
            , ALLSELECTED('Dates')
		)
        , ISONORAFTER(
			'Dates'[WeeknYear]
            , MAX('Dates'[WeeknYear])
            , DESC
            , 'Dates'[Week & Year]
            , MAX('Dates'[Week & Year])
            , DESC
		)
	)
)
Total Sales (RT, Month) = 
CALCULATE(
	[Total Sales]
    , FILTER(
		CALCULATETABLE(
			SUMMARIZE (
                'Dates'
                , 'Dates'[Month]
                , 'Dates'[Month Name]
            )
            , ALLSELECTED('Dates')
		)
        , ISONORAFTER(
			'Dates'[Month]
            , MAX('Dates'[Month])
            , DESC
            , 'Dates'[Month Name]
            , MAX('Dates'[Month Name])
            , DESC
		)
	)
)
Total Sales (RT, Quarter) = 
CALCULATE(
	[Total Sales]
    , FILTER(
		CALCULATETABLE(
			SUMMARIZE(
                'Dates'
                , 'Dates'[QuarternYear]
                , 'Dates'[Quarter & Year]
            )
            , ALLSELECTED('Dates')
		)
        , ISONORAFTER(
			'Dates'[QuarternYear]
            , MAX('Dates'[QuarternYear])
            , DESC
            , 'Dates'[Quarter & Year]
            , MAX('Dates'[Quarter & Year])
            , DESC
		)
	)
)
2 Likes

The “running total - but only for the periods shown in a matrix” appears to be the exact same thing as a simple sum. That is, I can match your image with the following simple measures:

DAX: Running Sales Total (Period)
SUM ( Sales1[Sales Amount] )

and

DAX: Running Sales Total
CALCULATE (
    SUM ( Sales1[Sales Amount] ),
    WINDOW ( 1, ABS, 0, REL, ORDERBY ( Dates[Date] ) )
)

image