DAX Workout 020 - Dynamic Titles and Subtitles

Challenge:

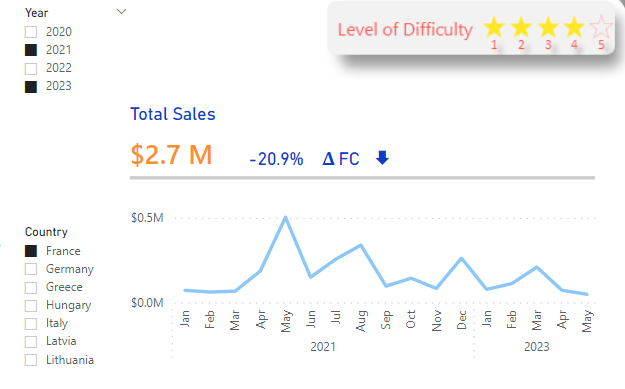
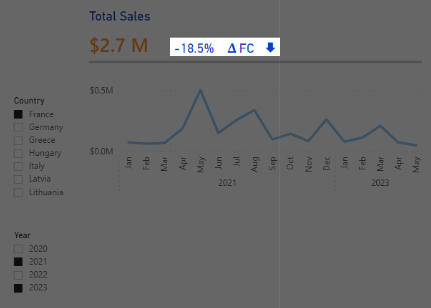
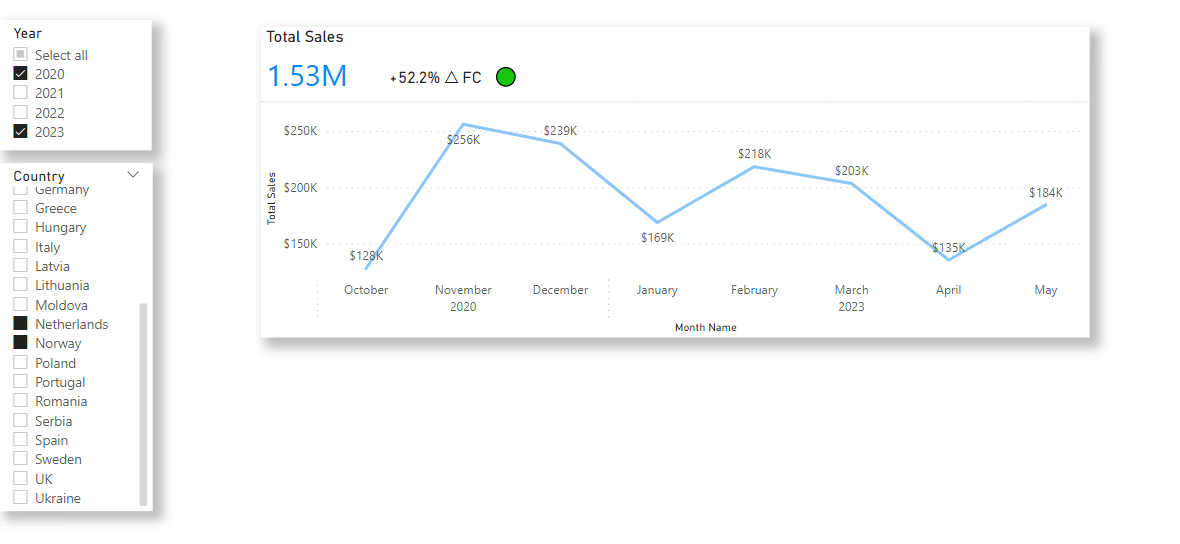
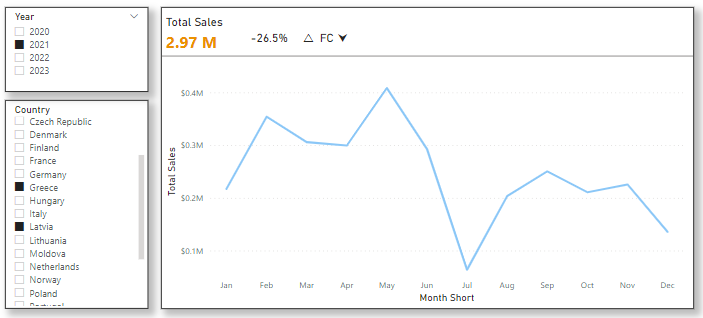
In this workout, you will create a dynamic title and subtitle for total sales with forecasting variance, including green and red arrows or icons to indicate positive and negative values along with the percentage in the subtitle.

The trick here lies in how you format the subtitle and the main title. It’s all in the padding and conditional formatting to get the different font sizes and colors.

Even though the Sales amount and the percentage value are on the same line, they are independent.

Also, in this dataset, I have included forecasting values for you using RAND(). A column called ForeCastingRand has been added to the Sales Table.

Feel free to bring in your own generic forecasting numbers to use. You will need Forecast Difference and Forecast Percent Difference.

Best of luck to you!

image

DAX _20 - Dynamic Title 05252023.pbix (667.6 KB)

Submission

Load the supplied data file into a new Power BI file, create your solution, and reply to this post. Upload a screenshot of your solution along with the DAX measure. Please format your DAX code and blur it or place it in a hidden section.

Period
This workout will be released on Thursday, May 25, 2023, and will end on Sunday, May 28, 2023. But you can always come back to any of the workouts and solve them.

1 Like

@Paul.Gerber just for clarification, is this highlighted number supposed to be the percentage difference between total sales and total Sales[ForeCastingRand]?

image

Yes you are correct

Good question. The FC is the forecast

ok. if that value is correctly calculated on your side then i must be misunderstanding something :laughing:

1 Like

Give me a minute and I’ll double check

@HufferD it should be -20.9%

1 Like

that’s what I thought. lol thanks for clarifying :sweat_smile:

1 Like

@HufferD I know you are on the right track. I don’t why that value was there. But I checked my solution.

-20.9%

Thanks, David

1 Like

It happens. thanks for clarifying. I see it’s fixed at the top, too. I was thinking maybe you had an unexposed filter on the original or something. I didn’t pull my hair out or anything.

1 Like

Thanks for asking

@Paul.Gerber

My submission:
submission

Thank you for planning this exercise.

1 Like

This looks great! I like how you have a slicer to change the icons

Hey All,
Here is my Submission

Dax Measures :
ForecastDifference AsTExt = “Total Sales”& REPT(UNICHAR(10),2) & Rept(" “,30) & FORMAT([ForecastDifference%], “+0.0%; -0.0%”) & " △ FC " & If([Total Sales] > 0 ,” :green_circle:"," :red_circle:")

Total Sales as Text = FORMAT([Total Sales], “#,##0,.00M”)

1 Like

Thanks for the workout, here is my submission

DAX Measure

This text will be hidden

Total Sales text =
"Total Sales" & UNICHAR ( 10 )
    & REPT ( " ", 28 )
    & FORMAT ( [Forecast Difference %], "0.0%" )
    & REPT ( " ", 5 ) & "△  FC"
    & IF (
        [Forecast Difference %] < 0,
        " " & UNICHAR ( 11167 ),
        " " & UNICHAR ( 11165 )
    )
1 Like

Maybe Its a case of the Memorial Day Weekend Hangover (even though I don’t drink). My percentages are way different…

Total Sales = SUM( Sales [Line Total])
Total Forecasted Sales = SUM(Sales[ForeCastingRand])
Forecasted Difference = [Total Forecasted Sales] - [Total Sales]
& Difference = ???

For Example: Using the numbers from Above (Greece / Latvia) in 2021

Sales: 2,968,274
Forecasted: 2,076,897
Difference: (891,377)
Difference % ?

Thanks in advance. Maybe I’m reading the instructions wrong.

more likely is that your numbers are off because of the random number. if it isn’t a set seed, the values will be different on every refresh.

2 Likes