DAX Workout 017 - Calculating Sales for a Specific Time Period

Everyone,

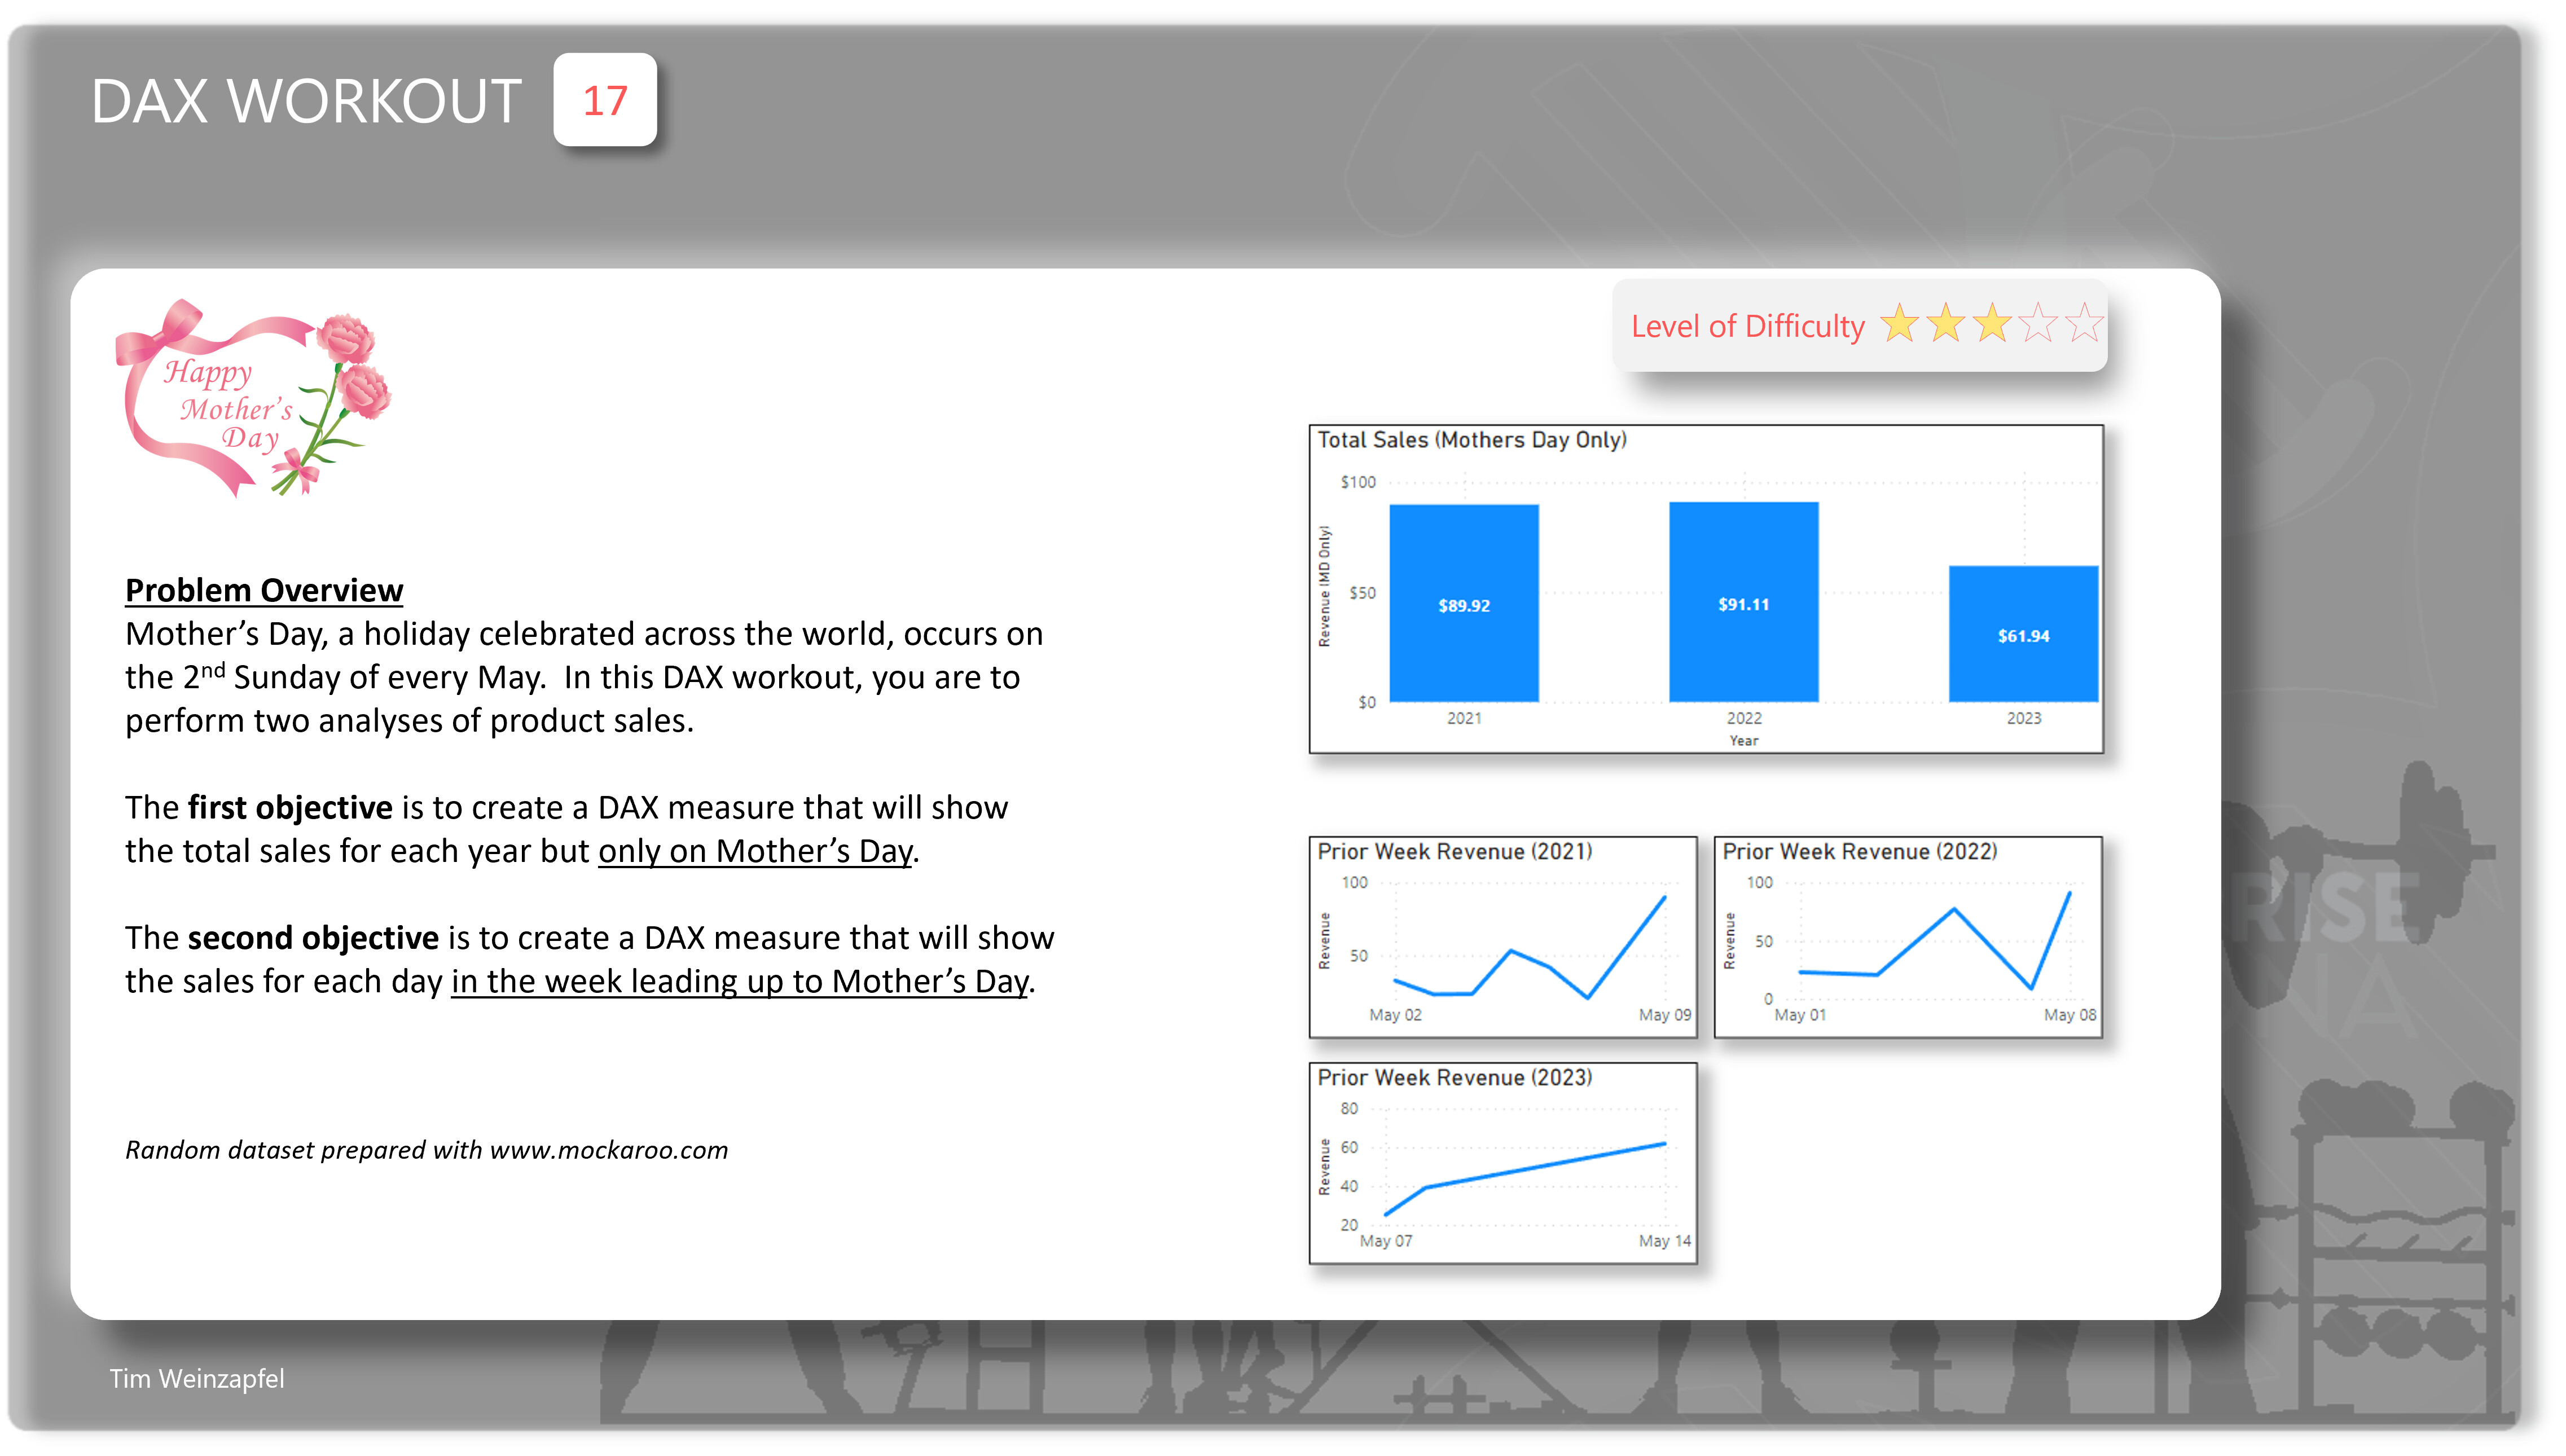
Mother’s Day, a holiday celebrated across the world, occurs on the 2nd Sunday of every May. In this DAX workout, you are to perform two analyses of product sales.

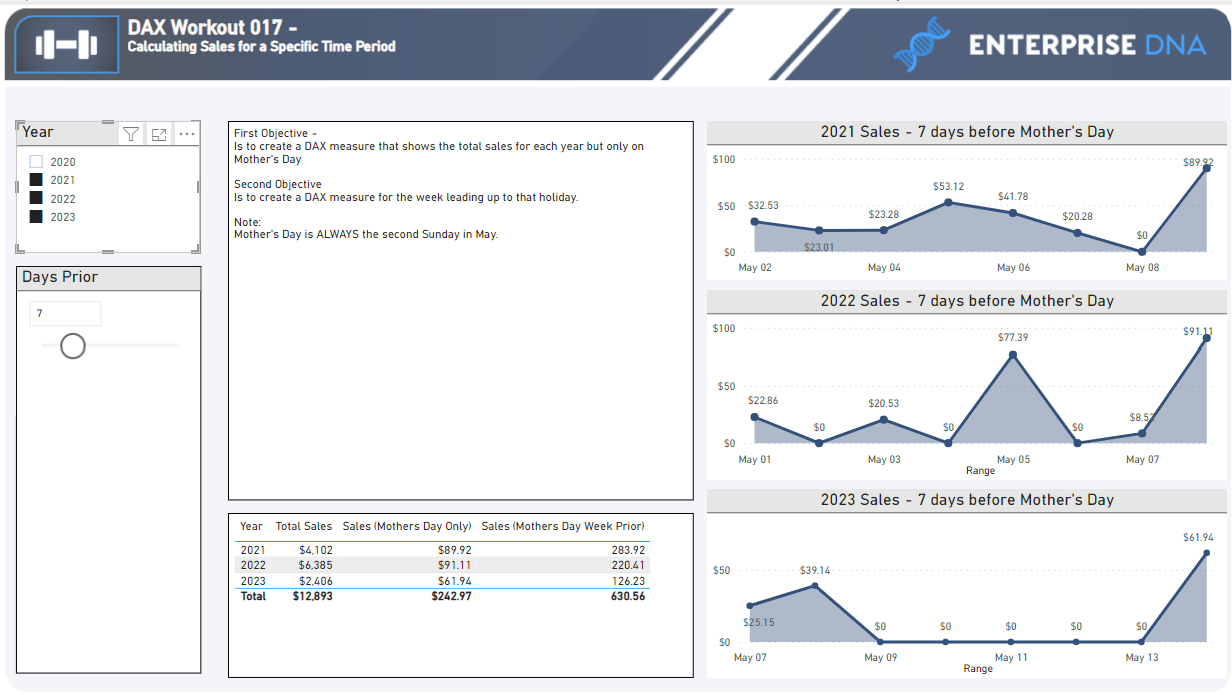
The first objective is to create a DAX measure that will show the total sales for each year but only on Mother’s Day.

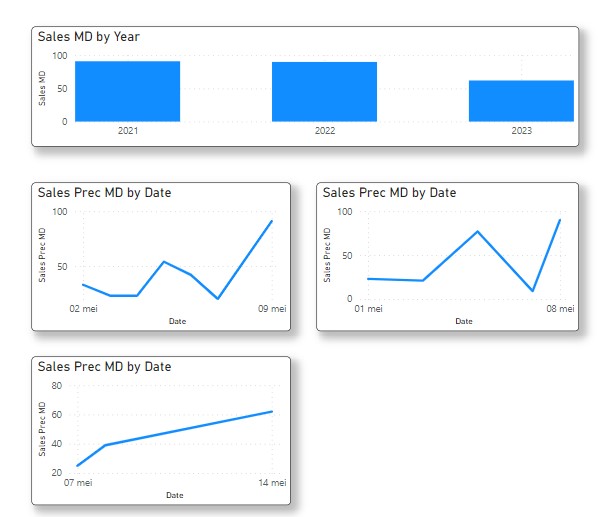
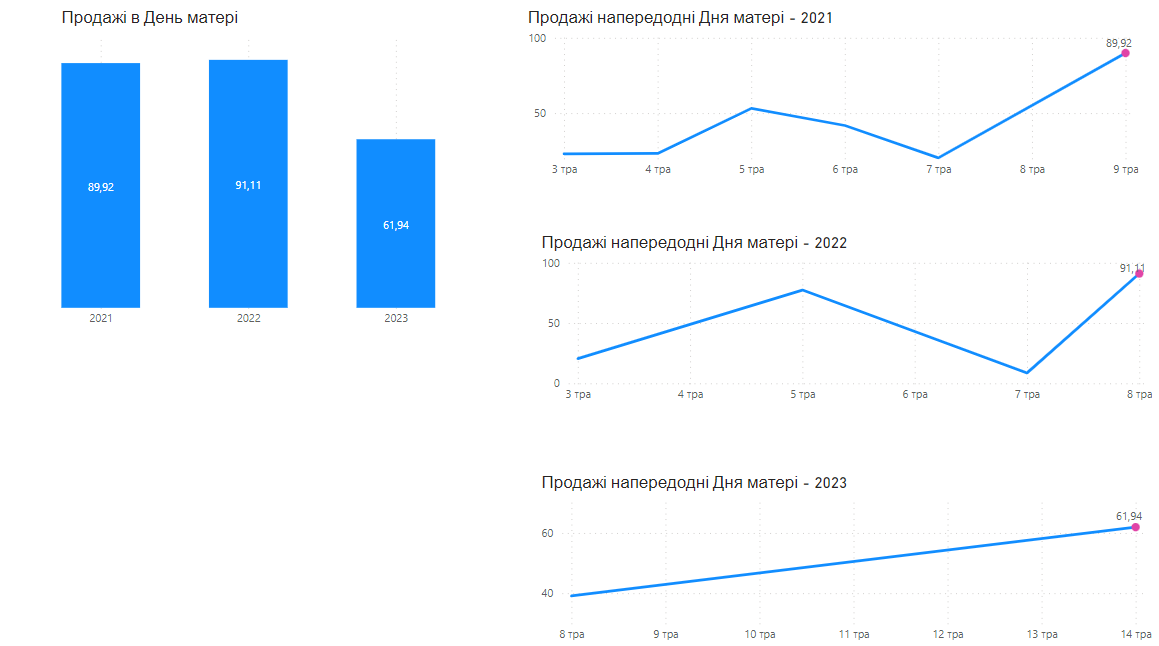
The second objective is to create a DAX measure that will show the sales for each day in the week leading up to Mother’s Day. In the picture that I’m providing I have a separate line chart for each year, but feel free to be creative with this (i.e. small multiples but factoring in that the x-axis will not have the same dates each year)

And if you haven’t already - call your mom. And if you are reading this workout after Mother’s Day - then you should still call your mom.

The dataset is below. Note that this was a randomly generated file using www.mockaroo.com.

Workout 017 Data.csv (29.4 KB)

Submission
Load the supplied data file, create your solution, and reply to this post. Upload a screenshot of your solution (or the PBI file) along with any DAX items. Please blur any solution or place it in a hidden section.

Hello and thanks for the challenge,

Here’s my submission :

  1. a created a measure for the mother’s day sales :
Total Sales (Mothers Day Only) = 
VAR _motherDays =
    CALCULATETABLE(
        VALUES ( Dates[Date] ),
        Dates[Week day num] = 0,
        Dates[Month] = 5,
        DAY( Dates[Date] ) > 7 && DAY ( Dates[Date] ) <= 14
    )

RETURN
    CALCULATE(
        SUM ( 'Workout 017 Data'[Total Sales] ),
        KEEPFILTERS( _motherDays )
    )

2/ I’ve created a measure to return the sales for the entire week preceding those days including the day itself :

Total Sales (Mothers Day Week Only) = 
VAR _mothersDay =
    CALCULATETABLE(
        VALUES( Dates[Date] ),
        Dates[Week day num] = 0,
        Dates[Month] = 5,
        DAY( Dates[Date] ) > 7 && DAY( Dates[Date] ) <= 14
    )


VAR _prevWeek =
    SELECTCOLUMNS(
        GENERATE(
            _mothersDay,
            VAR _currentDate = 'Dates'[Date]
            RETURN
            SELECTCOLUMNS(
                DATESBETWEEN( 'Dates'[Date], _currentDate - 7, _currentDate ),
                "@Date",
                'Dates'[Date]
            )
        ),
        "@Date",
        [@Date]
    )
RETURN
    CALCULATE(
        SUM ( 'Workout 017 Data'[Total Sales] ),
        KEEPFILTERS( _prevWeek )
    )

Next I’ve created three charts for the three years (cannot use the small multiples as x-axis can’t be synchronized)

Thanks !

Hi,

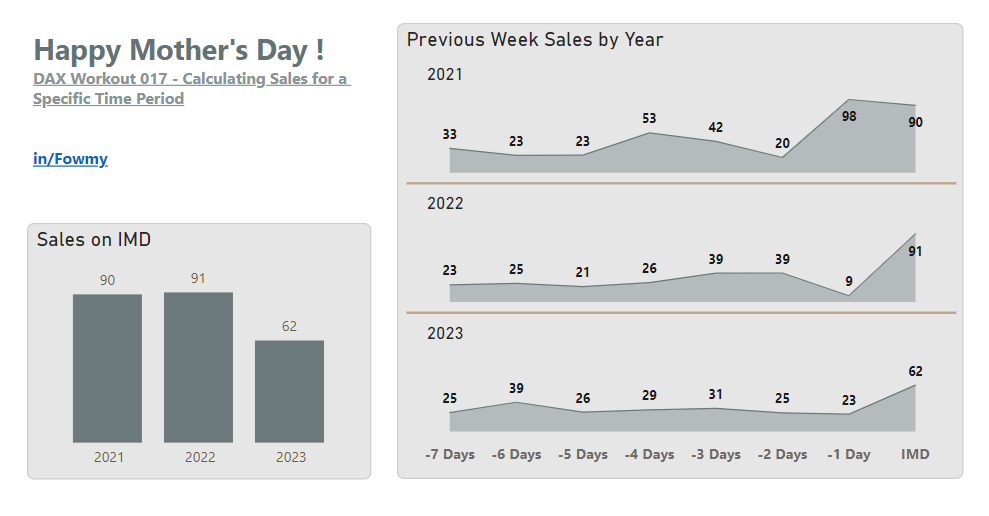
Thanks for posting this interesting challenge. This became more interesting when @tweinzapfel allowed me to feel free and be creative with Small Multiples :slightly_smiling_face:. I managed to do it as follows.
Fowmy - IMD Edna DAX Challenge-017.pbix (53.4 KB)

Note: I added data for the missing dates in May in all three years

Here is my solution:

  1. I added a simple Dates table then added a column to it in order to identify the IMD and past 7 days in each year.
IMD =
VAR __Year = 'Dates'[Year]
VAR __DatesRange =
    FILTER ( Dates, Dates[YEAR] = __Year && Dates[Month] = 5 && Dates[WeekDay] = 1 )
VAR __MoDate =
    INDEX ( 2, __DatesRange, ORDERBY ( Dates[Date], ASC ) )
VAR __DayDiff =
    MAXX ( __MoDate, Dates[Date] ) - Dates[Date]
RETURN
    SWITCH ( TRUE (), __DayDiff < 8 && __DayDiff >= 0, __DayDiff )
  1. Added an additional column "IMD Axis" to use later in the Line chart to sync the X-axis. 0 represents IMD here.
IMD Axis = 
VAR __Day = 'Dates'[IMD]
RETURN
SWITCH(
    TRUE(),   
    __Day == 0 , REPT(UNICHAR(8203), 10) & "IMD",
    __Day = 1 ,  "-" & __Day & " Day",
    __Day IN {2,3,4,5,6,7} ,  "-" & __Day & " Days"
)  

image

  1. The First measure used in the column chart to show the sales on IMD:
IMD Sales Amount =
CALCULATE ( [Sales Amount], Dates[IMD] == 0 )
  1. Next measure to show the trend of the IMD sales and the past week.
IMD Sales Trend =
CALCULATE ( [Sales Amount], NOT ( Dates[IMD] == BLANK () ) )
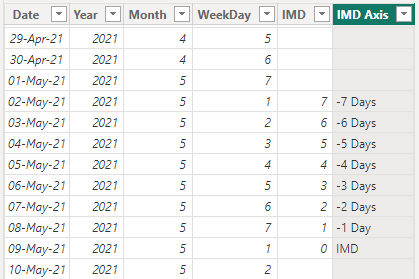
  1. To show the trend on a line chart and to split by different years using the Small Multiple option while synching the same level vertically, I used the calculated column “IMD Axis” on the X-axis of the line chart

Cheers!
Fowmy

PBIX is attached

1 Like

@tweinzapfel,

Thank you for preparing this.

My reproduction of your original post with both small multiples and overlaid lines:

I wasn’t terribly sure how to approach this one, so I created this (physical) table:

Mother's Day Weeks
Date:Mother's-Day = 
VAR __t1 = 
CALCULATETABLE(
    SUMMARIZE(
        Dates
        , Dates[Start of Week] 
        , Dates[Year] 
    )
    , Dates[Holiday]="Mother's Day" 
)
VAR __t2 = 
CALCULATETABLE(
    SUMMARIZE(
        Dates
        , Dates[Start of Week] 
        , Dates[Date] 
        , Dates[Year]
    )
)
RETURN 
SUMMARIZE( 
    NATURALLEFTOUTERJOIN(__t1,__t2)
    , Dates[Date]
    , Dates[Year]
)
  

and used it to control the context in the table showing Sales on the days leading up to Mother’s Day for each year and for the x-axis values in the charts. There’s bound to be a more elegant solution…

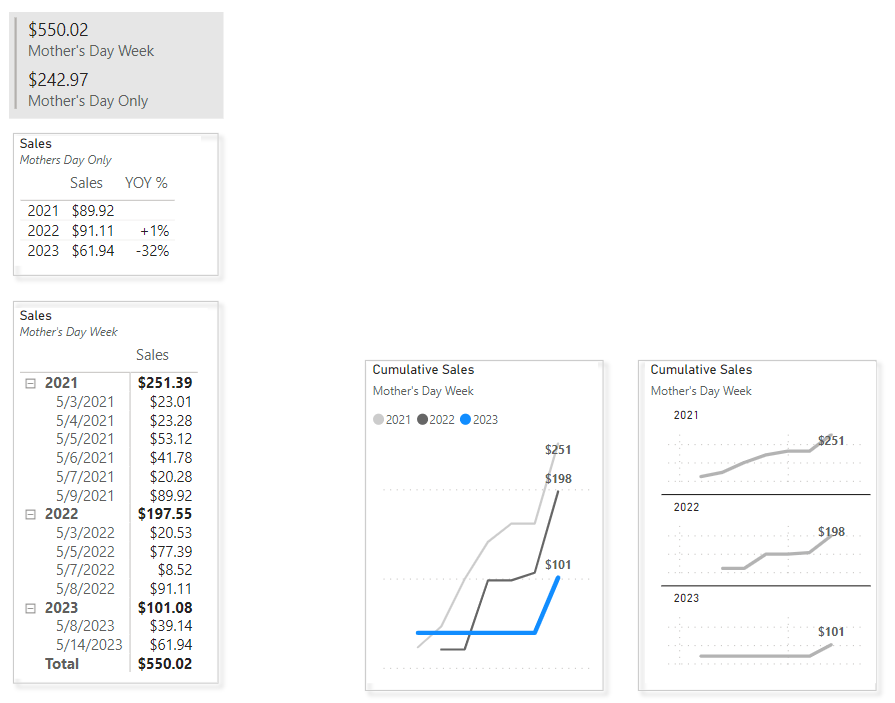
I used this measure to capture the last value per week of Mother’s Day:

Last Value
Sales (Week of Mother's Day) V2 (Last) = 
VAR __curRevDate = MAX(F[Date])
VAR __LastSale = 
    CALCULATE(
        MAX(Dates[Date])
        , ALLSELECTED(Dates)
        , GROUPBY('Date:Mother''s-Day','Date:Mother''s-Day'[Year])
    )
RETURN 
if (__curRevDate = __LastSale, [Sales (Week of Mother's Day) V2])

and used it to highlight the last value in the two figures.

1 Like

@zwhite - Can you explain this section a little ? I know what the end result is. I was able to generate Part I which was a list of days that were mothers day.

VAR _prevWeek =
SELECTCOLUMNS(
GENERATE(
_mothersDay,
VAR _currentDate = ‘Dates’[Date]
RETURN
SELECTCOLUMNS(
DATESBETWEEN( ‘Dates’[Date], _currentDate - 7, _currentDate ),
@Date”,
‘Dates’[Date]
)
),
@Date”,
[@Date]
)

@Fowmy - I like how you approached the small multiples here. Since you have to have the same access - the actual dates won’t line up - but your approach of using just a simple -n Days is a great way to show that.

2 Likes

@mbraun sure,

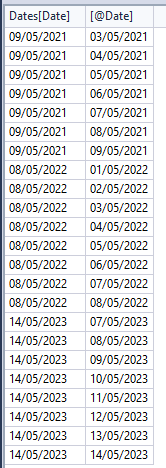
The previous variable _mothersDay gets a table with one column (Dates[Date]) and contains only mother’s day (3 rows : one for each year).

The goal was to generate the previous weeks for each of this day. the GENERATE function is an iterator which allow to do a CROSSJOIN in a row by row context.
Example : for the first mother’s day (2021-05-09), it creates a column containing the whole preceding week.
Here’s what the table looks like :
image

The SELECTCOLUMNS returns only one column because now the two columns created by GENERATE has a lineage to the same column of the model (Date) and if I keep both column the result will not be computed accordingly to the dates I want to keep in the filter context.

There’s probably a better way to do that

Hope it’s clear

Thank you !

I got there using windows functions, gotta love them!

Here’s the DAX

1 Like

Definitely need to find tune this to get it to be more reactive/dynamic then hardcoding some values.

Life is not as easy as it seems, it is easier)

Summary
MD Sales = 
VAR tables = FILTER('Date', 'Date'[Week] = 20 && 'Date'[Weekday number] = 7)
VAR result = CALCULATE([Sales], tables)
RETURN
result
Summary
7d MD Sales = CALCULATE([Sales], 
    ('Date'[Week] = 20 && 'Date'[Weekday number] = 7) 
    ||
    ('Date'[Week] = 19 && 'Date'[Weekday number] <> 7))

Amazing, the easiest logic for the problem!

I first had to convert the Date. I then added a couple of columns

Column 1 - Converted Date = DATEVALUE([Date])
Column 2 - Weekday Name = FORMAT([Converted Date].[Date],“DDDD”)
Column 3 - Year = YEAR(‘Workout 017 Data’[Converted Date])

Then I added some measures

Measure 1
Mother’s Day =
VAR YearOfDate = YEAR([Converted Date])
VAR MayFirst = DATE(YearOfDate, 5, 1)
VAR FirstSunday = MayFirst + SWITCH(WEEKDAY(MayFirst, 1), 1, 0, 2, 6, 3, 5, 4, 4, 5, 3, 6, 2, 7, 1)
VAR SecondSundayOfMay = FirstSunday + 7
RETURN SecondSundayOfMay

Measure 2 -
Days to Mother’s Day = DATEDIFF([Converted Date], [Mother’s Day], DAY)

In doing so, the formulas are completely variabilised for any year. The days to Mothersday allow now to check sales not only for the week, which I find more practical. Just use a filter.