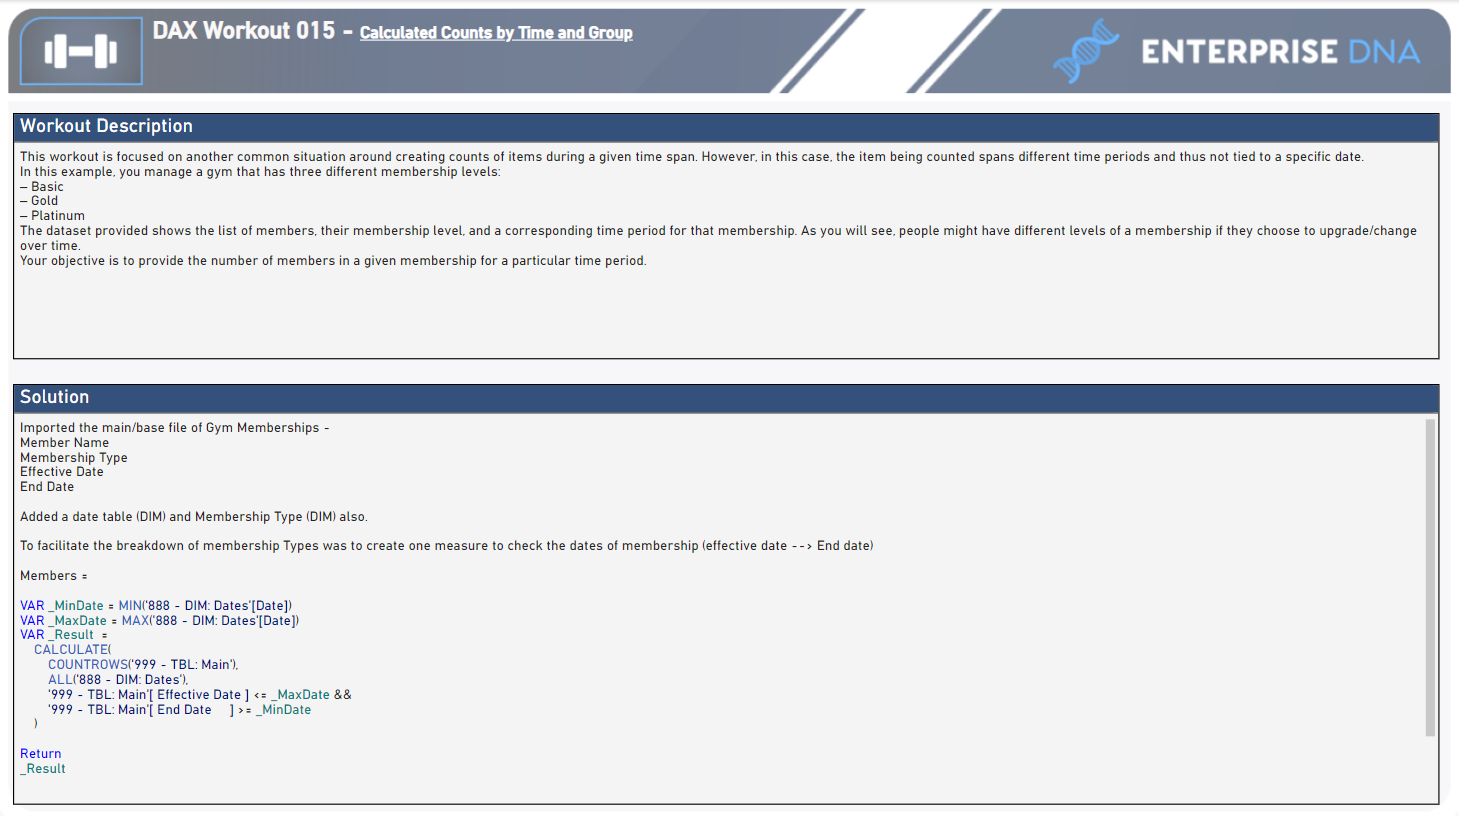
This workout is focused on another common situation around creating counts of items during a given time span. However, in this case, the item being counted spans different time periods and thus not tied to a specific date.
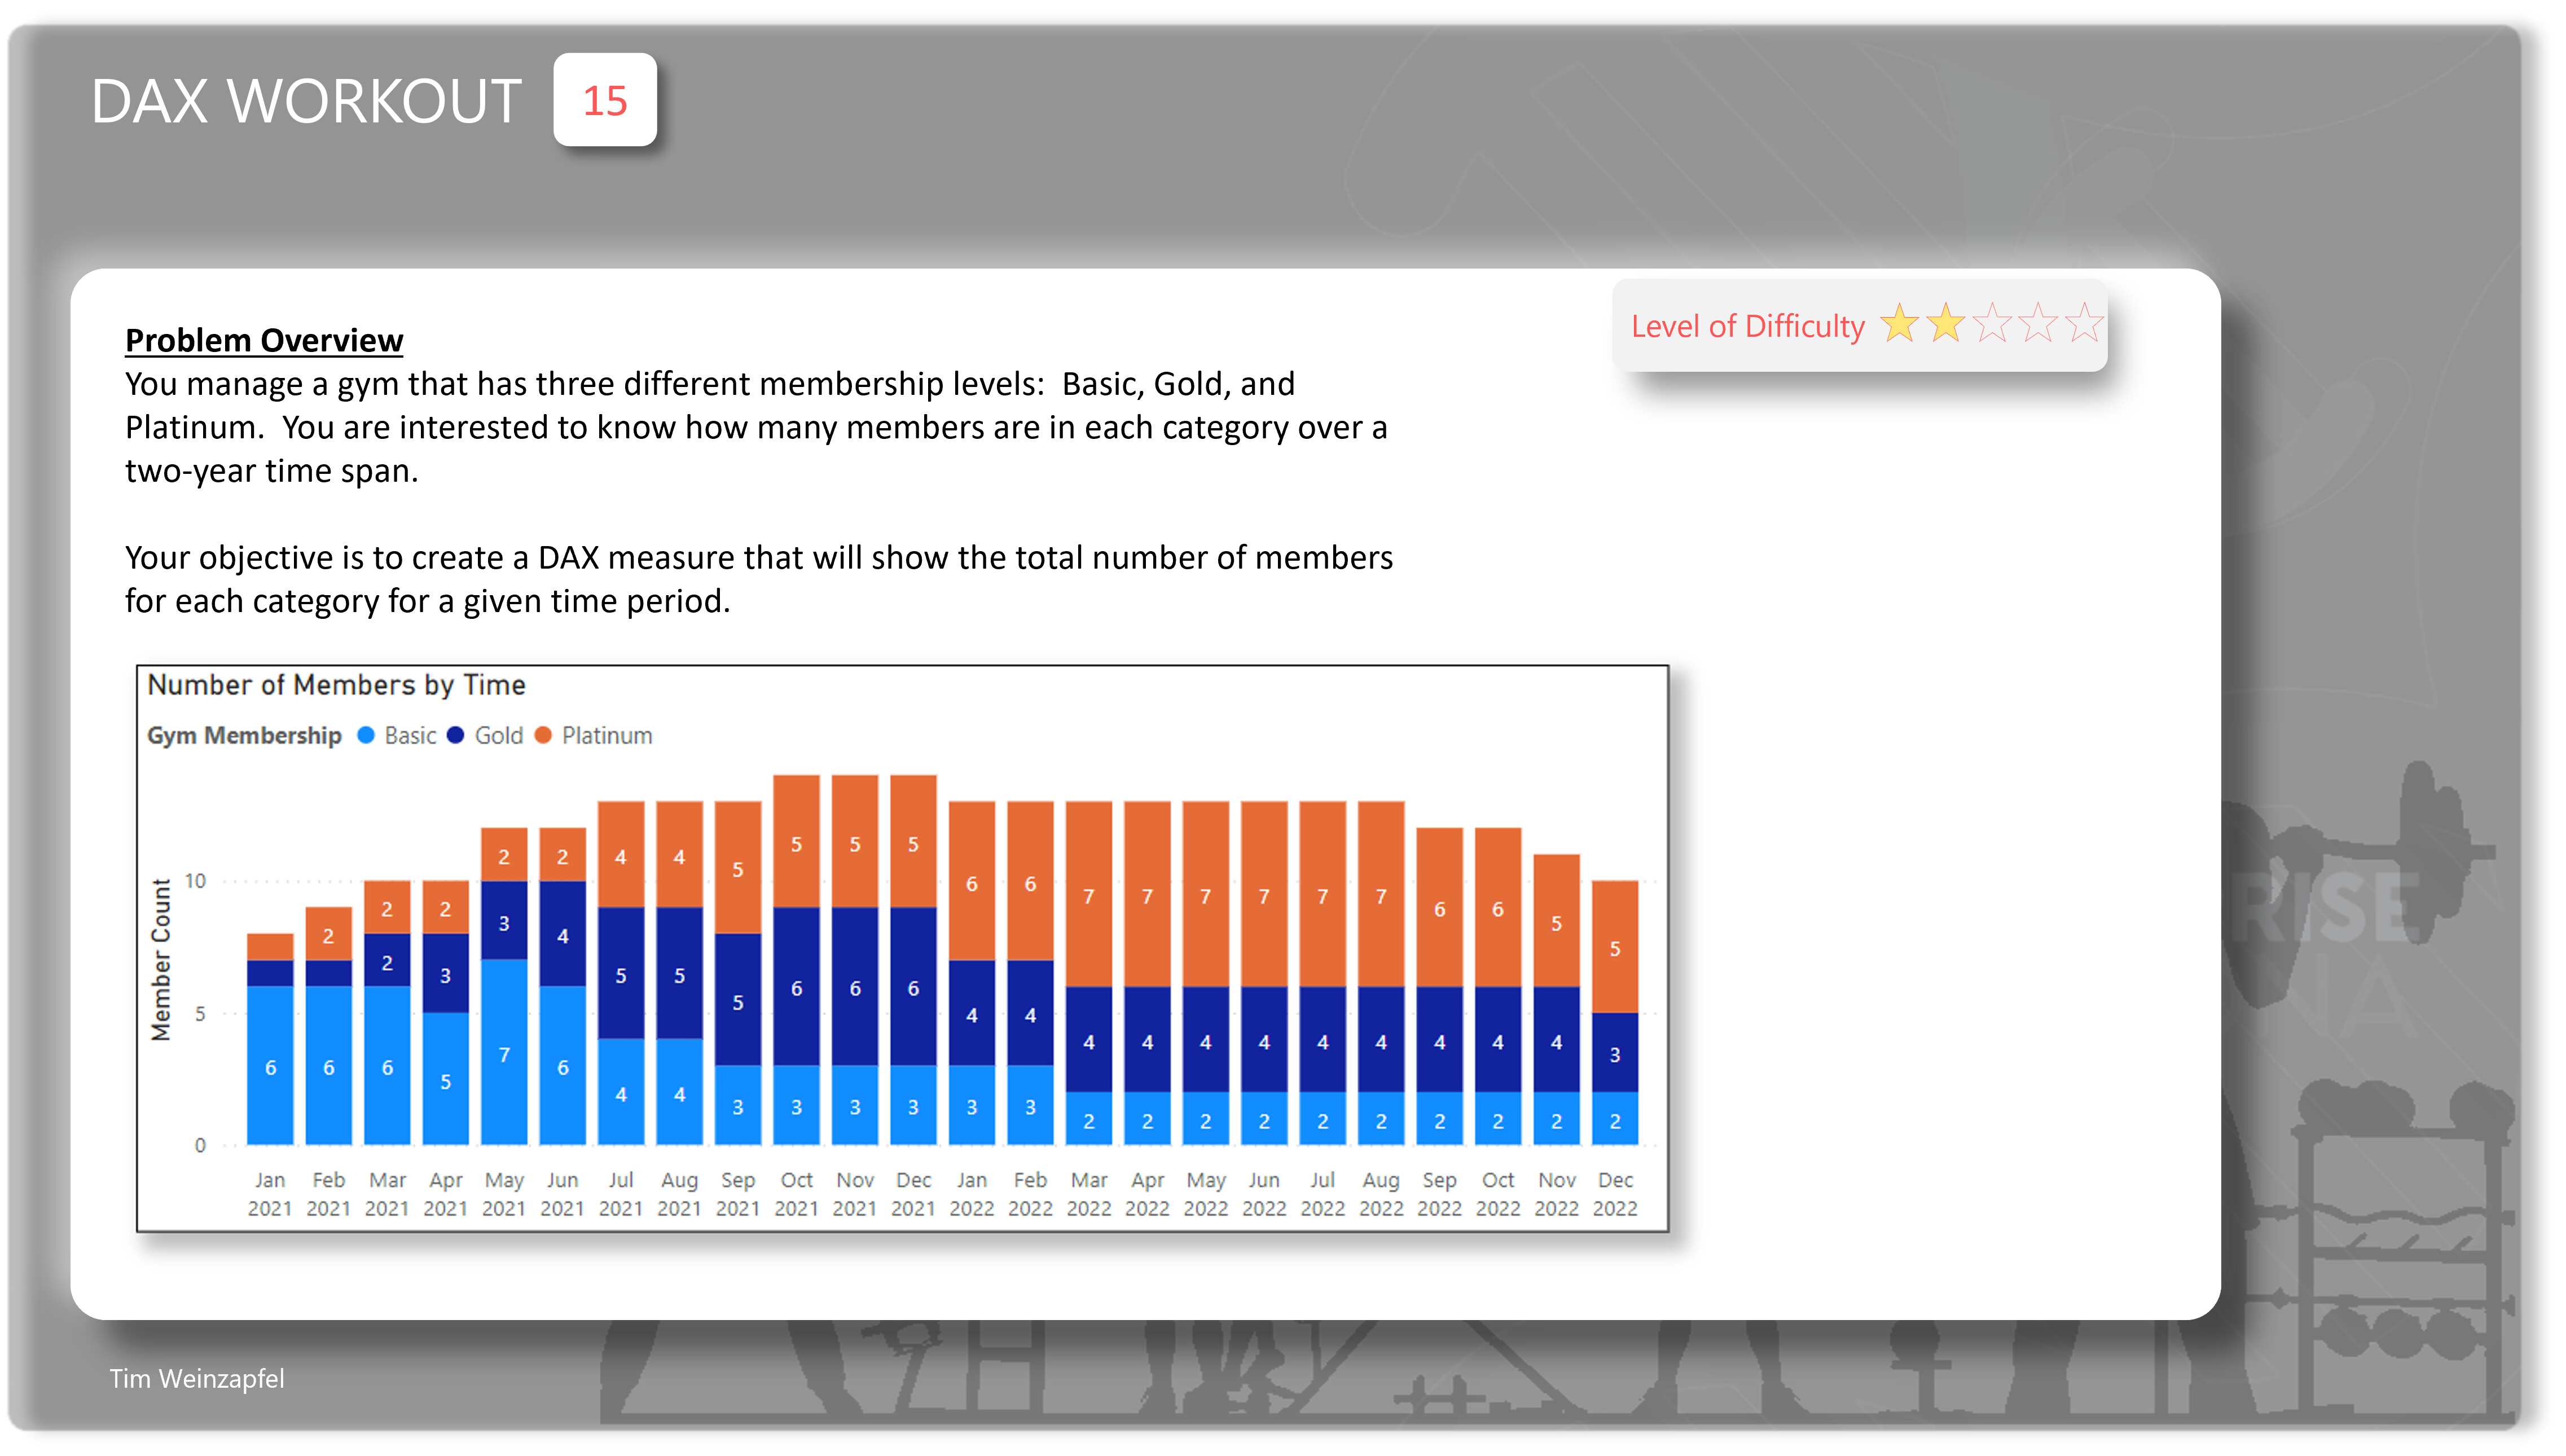
In this example, you manage a gym that has three different membership levels:
– Basic
– Gold
– Platinum
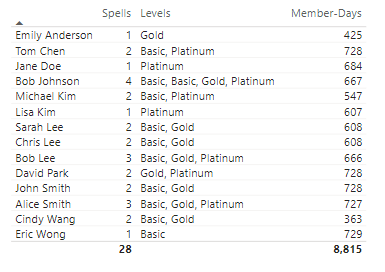
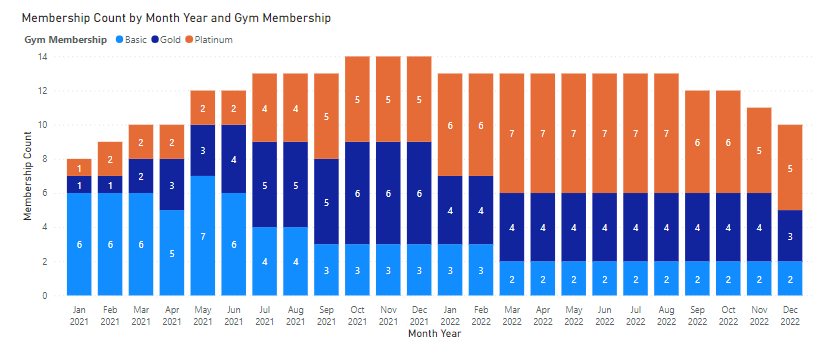
The dataset provided shows the list of members, their membership level, and a corresponding time period for that membership. As you will see, people might have different levels of a membership if they choose to upgrade/change over time.
Your objective is to provide the number of members in a given membership for a particular time period.
Submission
Load the supplied data file, create your solution, and reply to this post. Upload a screenshot of your solution (or the PBI file) along with any DAX items. Please blur any solution or place it in a hidden section.
My solution feels very hacky but I guess it works. I don’t feel like I created all the necessary relationships, and it wouldn’t really allow for dynamic analysis.
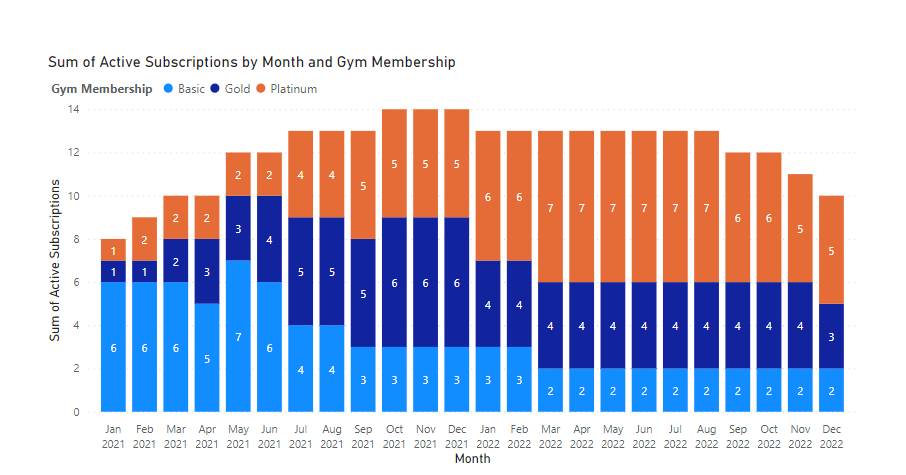
My approach was to attempt to create a “subscriptions renewal” table that lists out each month for which a subscription continues to exist, then count the rows in that table to get the number of active subscriptions in each month.
Here’s how the DAX looks like:
Membership counts table =
 VAR memberstable = VALUES('Members')
 VAR monthtable = ADDCOLUMNS(
                        VALUES(Dates[MonthInCalendar]),
                        "dates", CALCULATE(MAXX(Dates, Dates[Date]))
                    )
 VAR crossed = CROSSJOIN(monthtable, memberstable)
 VAR activemembers = FILTER(crossed,
                        AND([dates]>='Members'[Effective Date], [dates] <= 'Members'[End Date]))
 VAR summarytable = SUMMARIZE(activemembers,
                        Dates[MonthInCalendar], [dates], 'Members'[ Gym Membership ],
                        "Active Subscriptions", COUNTA('Members'[ Gym Membership ]))
RETURN
summarytable
I’ll likely revisit this later to clean it up, but I just thought I’d put in my submission anyway, lest I fail to submit at all. It was a great learning experience working out with DAX all Sunday
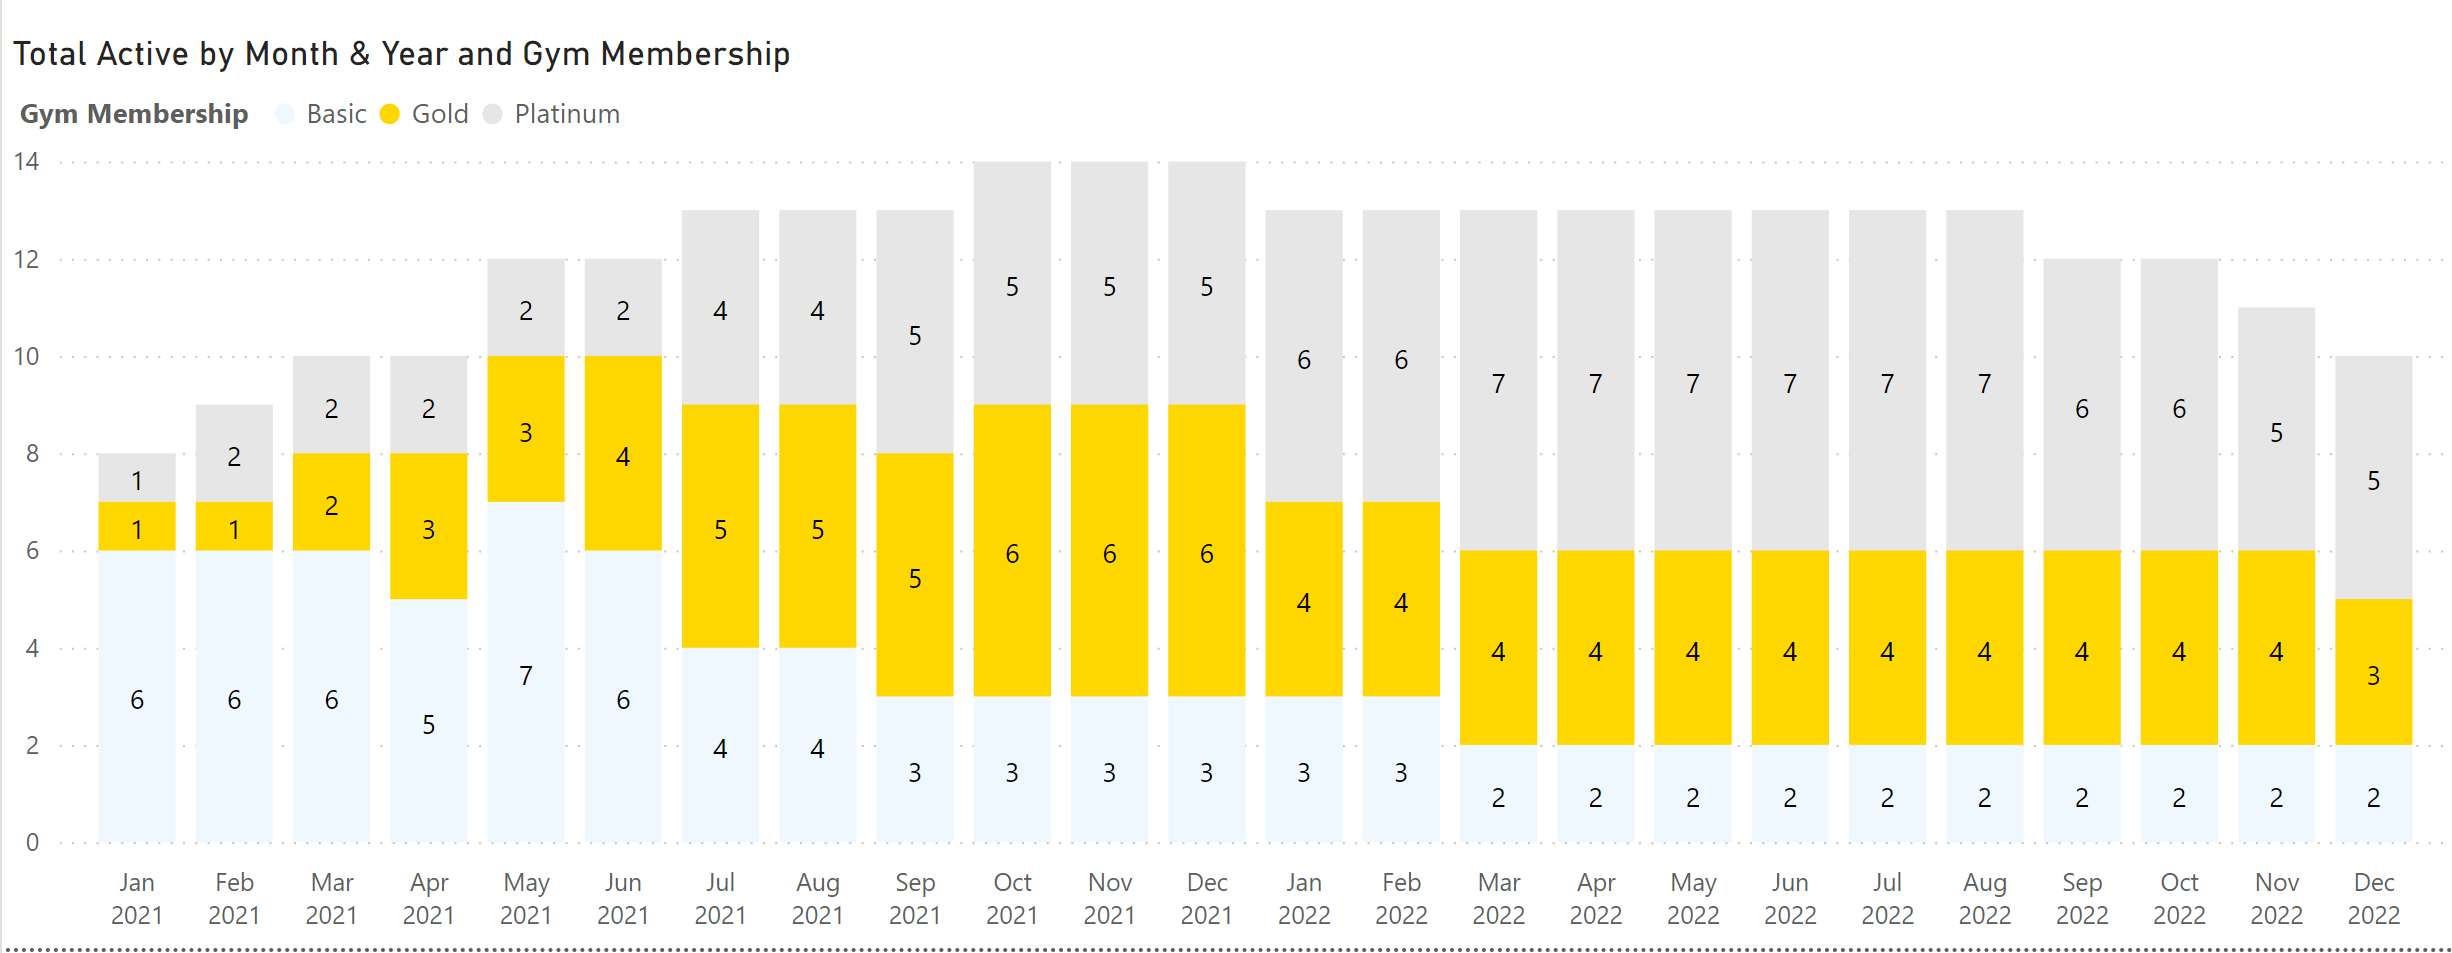
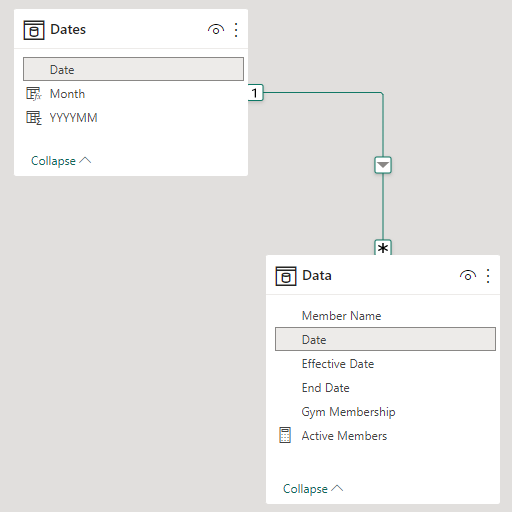
I used a disconnected Dates table, but you could accomplish the same thing by making both relationships inactive. The key here is to have the time period selection not filter the main data table.
Total Active =
VAR __vTable =
ADDCOLUMNS(
    Data,
    "@Active", [Active]
)

VAR __Result =
SUMX(
    __vTable,
    [@Active]
)
RETURN __Result
Get MonOffset =
SELECTEDVALUE( 'Disconn Dates'[MonthOffset] )
As I imagined. I already finished writing my DAX before realizing I skipped data modeling. And then going back to it at that point just broke my calculations. I should start again from scratch and see what I can create with a proper data model
These next two are extra and a start towards something potentially helpful for marketing and retention:
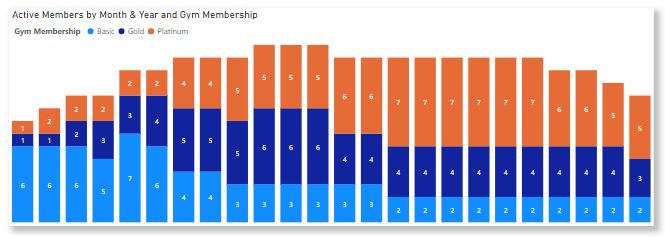
If you wanted to understand change in membership levels over time perhaps…like why your platinum membership starting shrinking in Sep 2022 or if reductions in basic memberships reflect members moving to higher levels (all but one case) versus leaving the club.
And you might want to examine movement within member, like
where you could work towards identifying certain groups of members, like members in basic or gold that haven’t moved to higher levels or members in platinum or gold that dropped to lower levels.
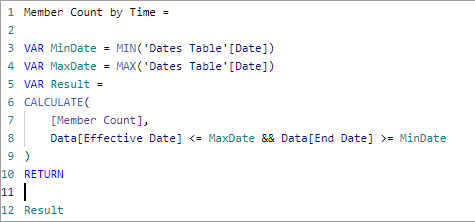
The way I did it, the key measures all depend on
Member Count
Member Count =
VAR MinDate = MIN ( 'Date'[Date] )
VAR MaxDate = MAX ( 'Date'[Date] )
VAR Result =
    CALCULATE (
        COUNTROWS ( Membership )
        , Membership[Effective Date] <= MaxDate
        , Membership[End Date] > MinDate
        , REMOVEFILTERS ( 'Date' )
    )
RETURN
    Result
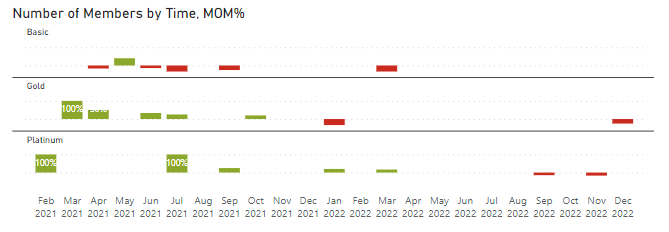
The two additional measures (for the month-over-month percentage change)
MOM%
PM Member Count =
VAR __CurrentYearMonthNumber = SELECTEDVALUE ( 'Date'[Year Month Number] )
VAR __PreviousYearMonthNumber = __CurrentYearMonthNumber - 1
VAR __Result =
    CALCULATE (
        [Member Count]
        , REMOVEFILTERS ( 'Date' )
        , 'Date'[Year Month Number] = __PreviousYearMonthNumber
    )
RETURN
    __Result

MOM % Member Count =
DIVIDE (
    [MOM Member Count]
    , [PM Member Count]
)
Awesome post! Love the way you’ve expanded the analysis to look at changes over time.
This is what I’ve been doing too on the workouts - just using them to maximize my own learning by taking them in additional directions to encompass some new learnings.
Thanks for participating - keep up the great work!
Thanks! These are great ways to spend restless nights and sleepless mornings. Because of the intensity of some of these workouts, I expect at some point the developers will tire of preparing them all. It’s a good distraction for now.
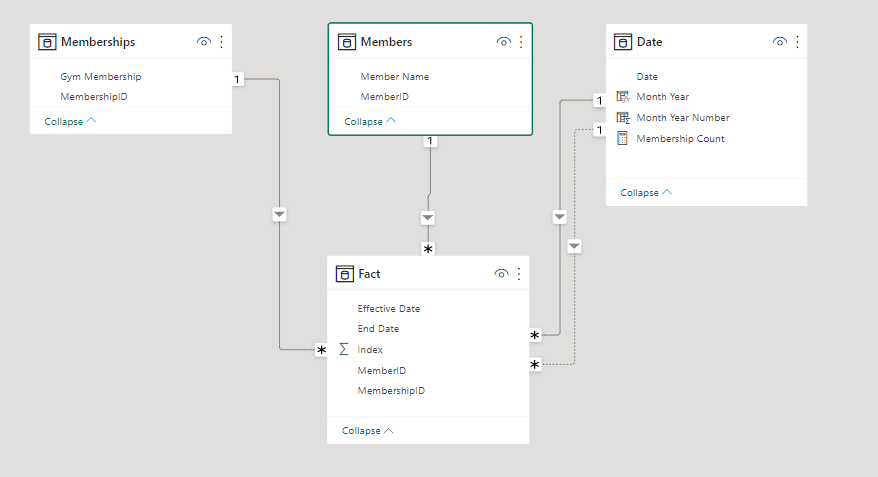
I created two inactive relationships between the dates and the fact tables (by linking the effective and enddate columns in the fact table to the date column in the dates table.
Did a countrow of the fact table over a time period removing any filter on the date table in the process.
pretty straightforward with a disconnected Date table :
VAR _actualStartDate = MIN ( 'Dates'[Date] )
VAR _actualEndDate = MAX ( 'Dates'[Date] )

VAR _memberCountInPeriod =
        CALCULATE(
            DISTINCTCOUNT( 'data'[ Member Name  ] ),
           'data'[ Effective Date ] <= _actualEndDate && 'data'[ End Date     ] >= _actualStartDate
        )

RETURN _memberCountInPeriod
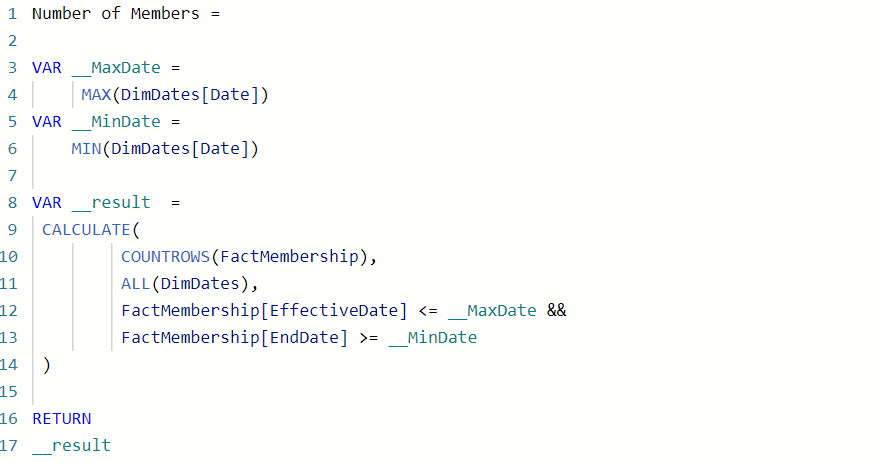
This is my first gif so I was just testing things out. Here’s my code.
Active Members =

var minDate = min(dates[Date])
var maxDate = max(dates[Date])

var result = CALCULATE([number of members], ALL(dates), GymMemberships[ Effective Date ] <= maxDate,
                                                        GymMemberships[ End Date     ] >= minDate
)

return

result
I just came back to this as promised, but it seems I’ve lost the ability to edit the post.
Instead of creating a whole new table in the model, I’ve improved the code to simply perform the entire calculation in a single measure. The logic is still the same. Create a table that lists out the months where each member remained active, then count the rows in the table
Summary
Active members count =

 VAR memberstable = VALUES('Members')
VAR monthtable =
ADDCOLUMNS(
    VALUES(Dates[MonthInCalendar]),
    "dates", CALCULATE(MAXX(Dates, Dates[Date]))
)
 VAR crossed = CROSSJOIN(monthtable, memberstable)
 VAR activemembers =
 FILTER(crossed,
    AND([dates]>='Members'[Effective Date],
    [dates] <= 'Members'[End Date])
)
VAR _result = COUNTROWS (active members)
RETURN
_result
I got to see the workout late, but I had to try it out.
Count Gym members over a period of 2 years =
var _MinDate = MIN ( ‘Date’[Date] )
Var _MaxDate = MAX ( ‘Date’[Date] )
Var _MemberDistribution =
CALCULATE( DISTINCTCOUNT( ‘Dax workout 15’[ Member Name ] ),
ALL( ‘Date’),
‘Dax workout 15’[ Effective Date ] <= _MaxDate ,
‘Dax workout 15’[ End Date ] >= _MinDate )
Return
_MemberDistribution
All - once again some great approaches to this. While it is certainly possible to use a Dates table relationship, as some have shown here, it’s also possible to do it without any relation to the Dates table.
My approach
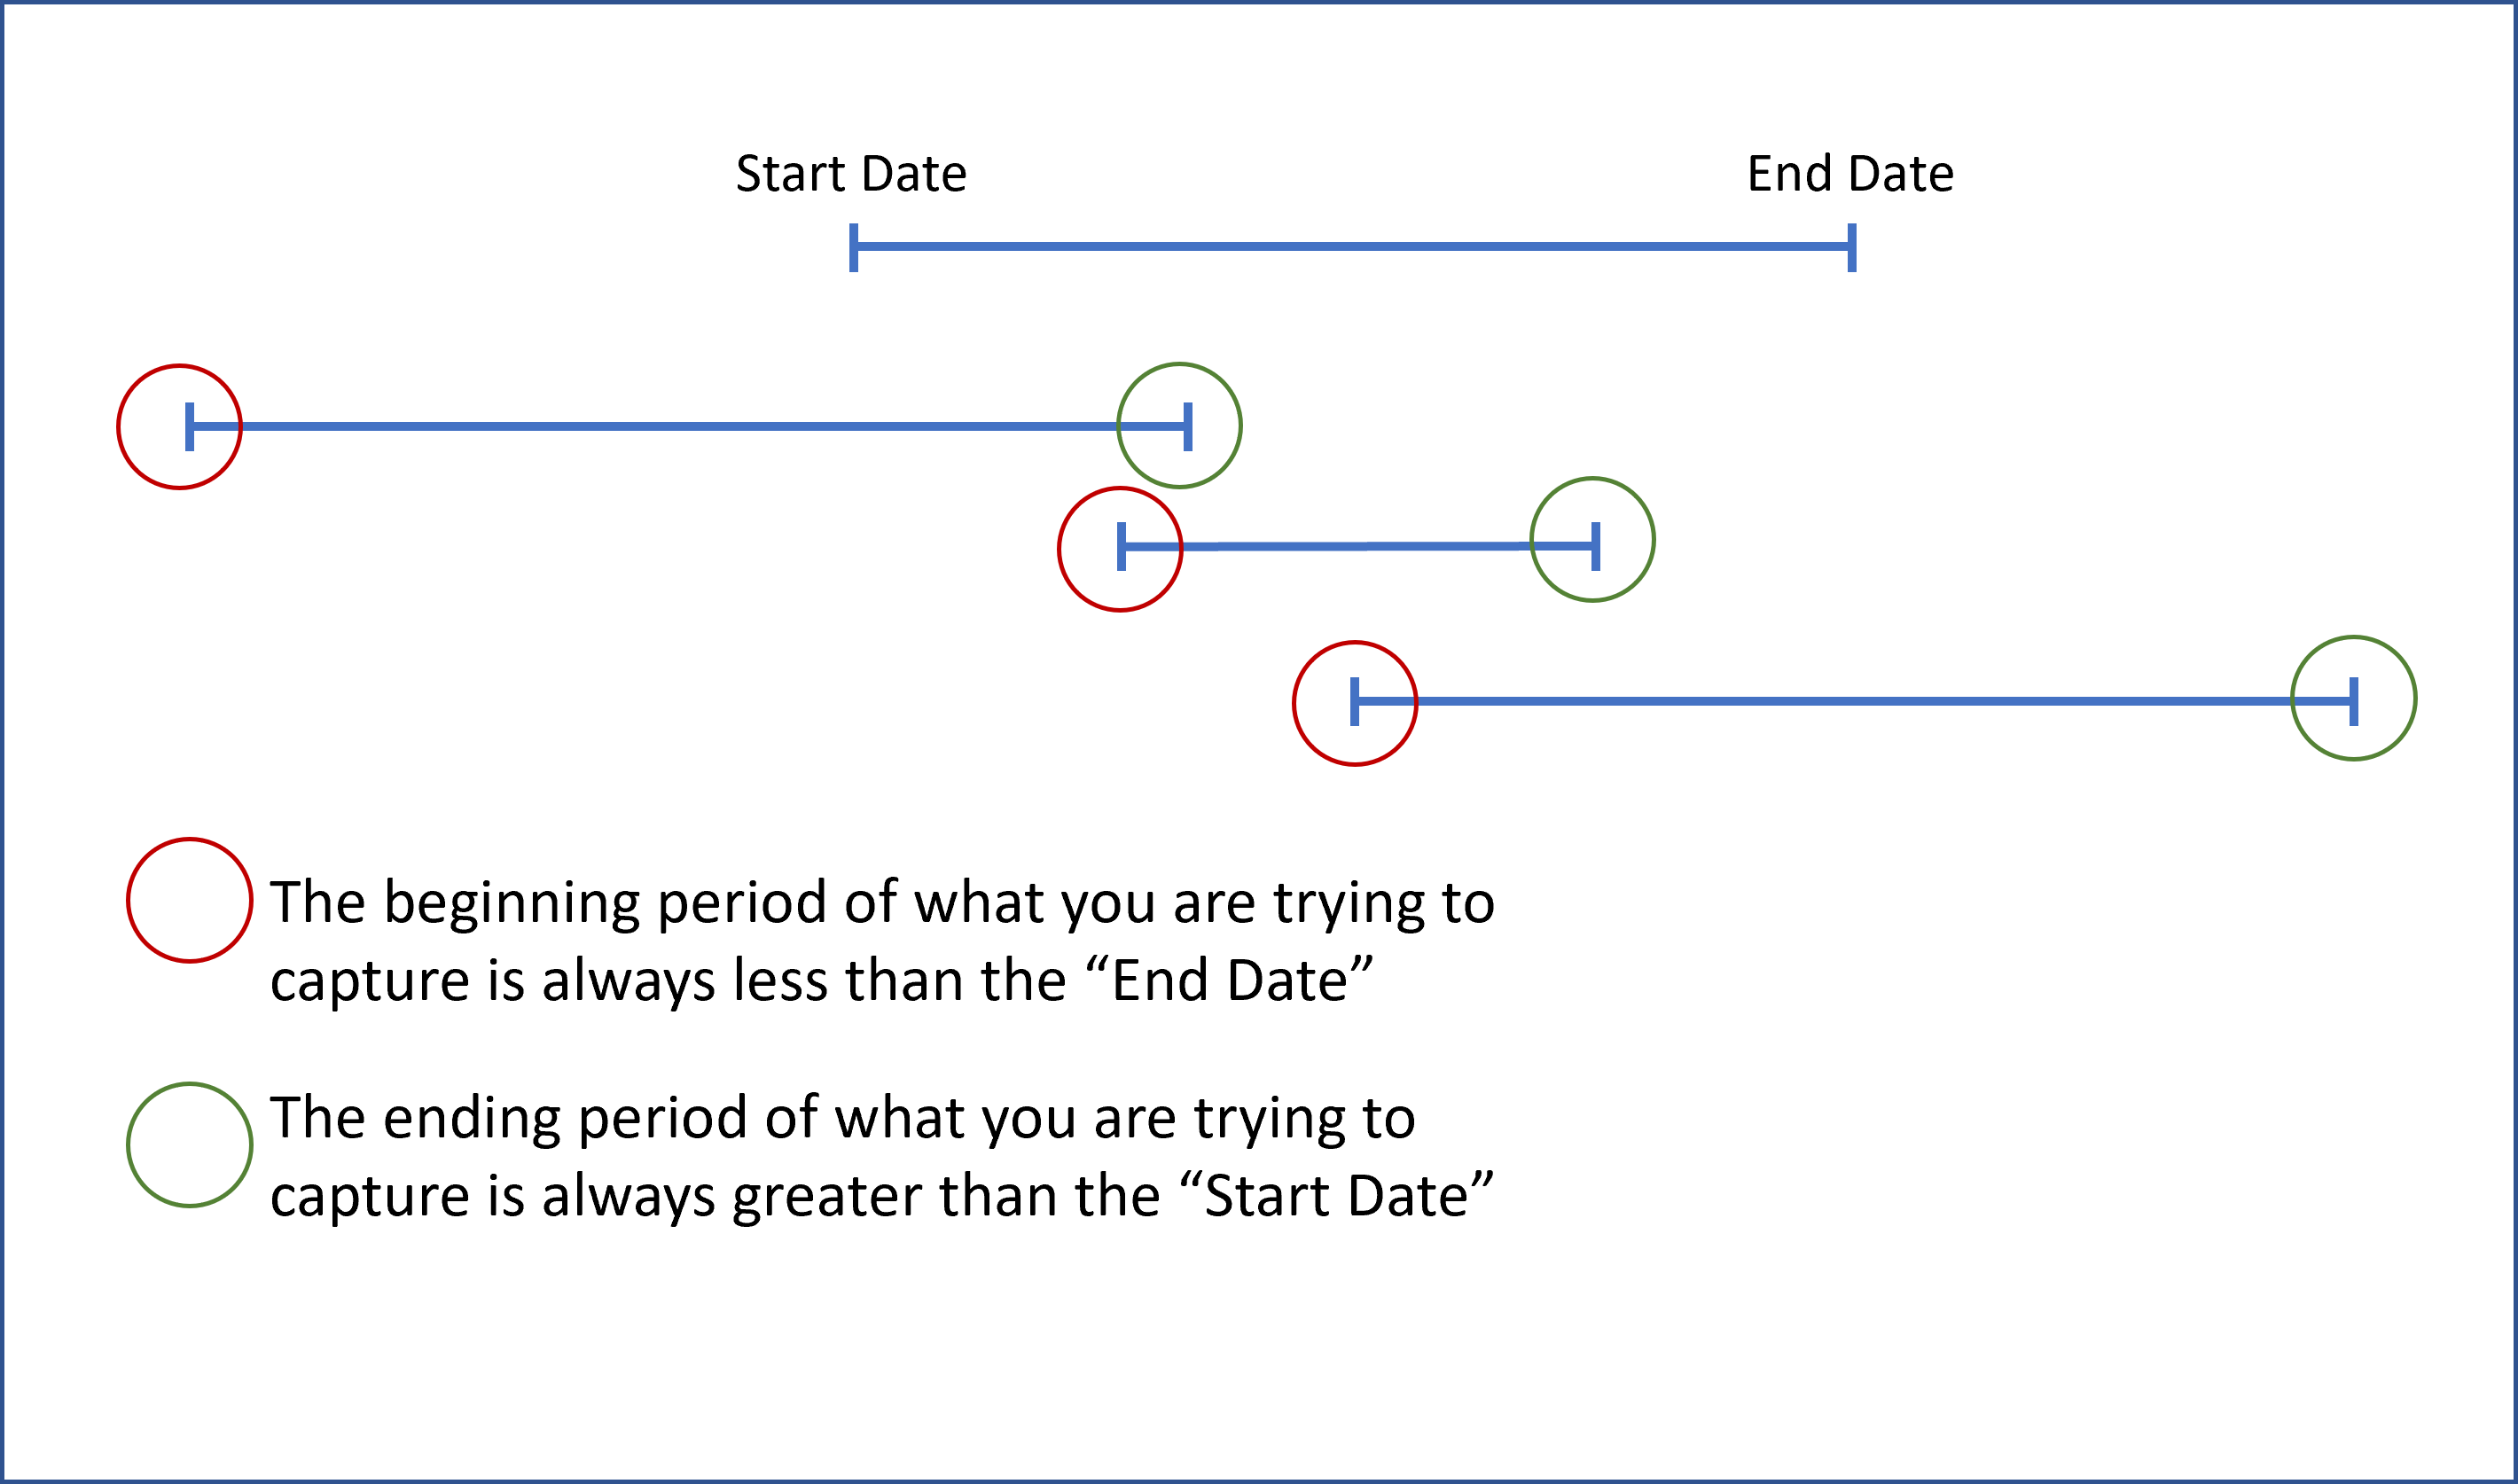
Similar to others, a simple DAX measure can help with this. The key is getting the date logic to account for the various situations that can apply. I have added a visual as well to explain this. When are you trying to capture the total number of items that could occur during a date range, you have to account for the different situations. So using this example, if I want to count up the total number of memberships in a given year, some memberships were activated in a prior year, but will continue; some memberships might be created in that year - but also end. And some memberships will be created in the year but continue into a future year.
Date Table =
ADDCOLUMNS (
    CALENDARAUTO (),
    "Year", YEAR ( [Date] ),
    "Month & Year",
        FORMAT ( [Date], "mmm" ) & " "
            & FORMAT ( [Date], "YY" ),
    "MonthnYear", FORMAT ( [Date], "YYYYMM" )
)
Active Members =
CALCULATE (
    COUNT ( data[ Member Name  ] ),
    data[ Effective Date ] <= MAX ( 'Date Table'[Date] )
        && data[ End Date     ] >= MIN ( 'Date Table'[Date] )
)