Another common issue that I see is doing analysis on turnaround time. Many situations arise where you have a beginning date (be it an order/sales/start date) and an ending date (completed/delivered, etc.). So naturally a great analysis is monitoring the time in between.
But - what if only business days are wanted? And what if holidays are to be excluded?
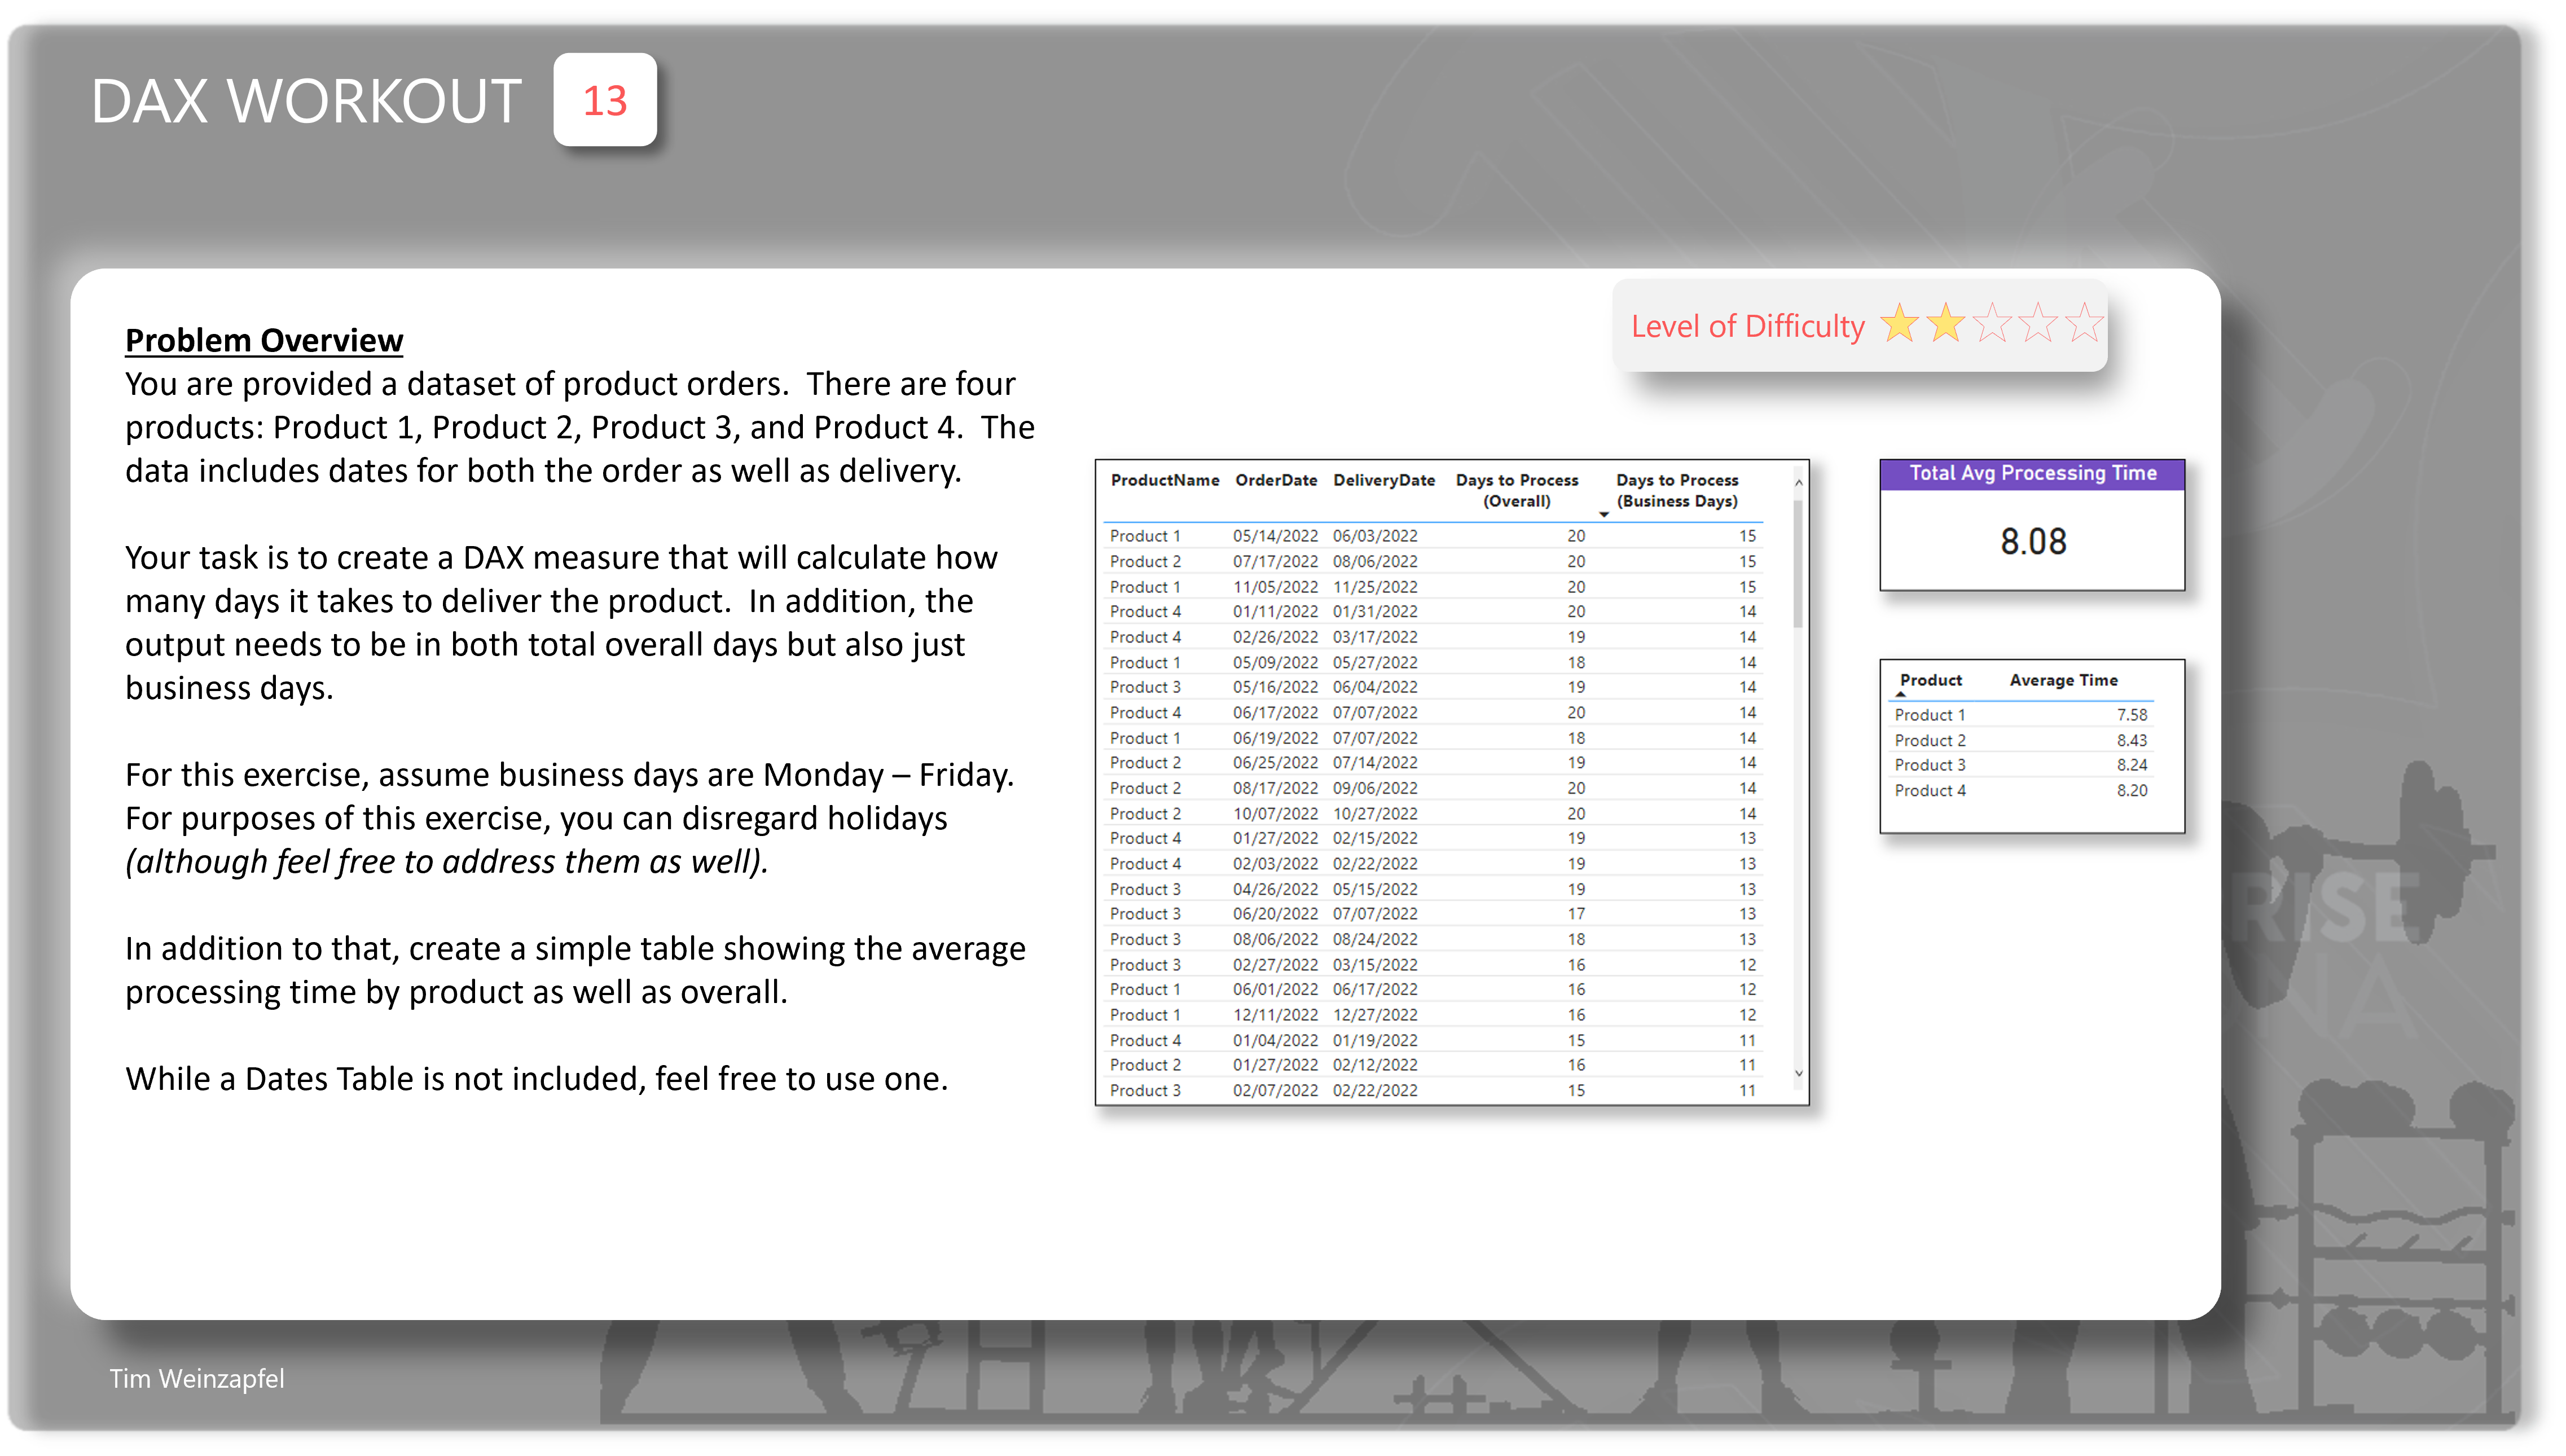
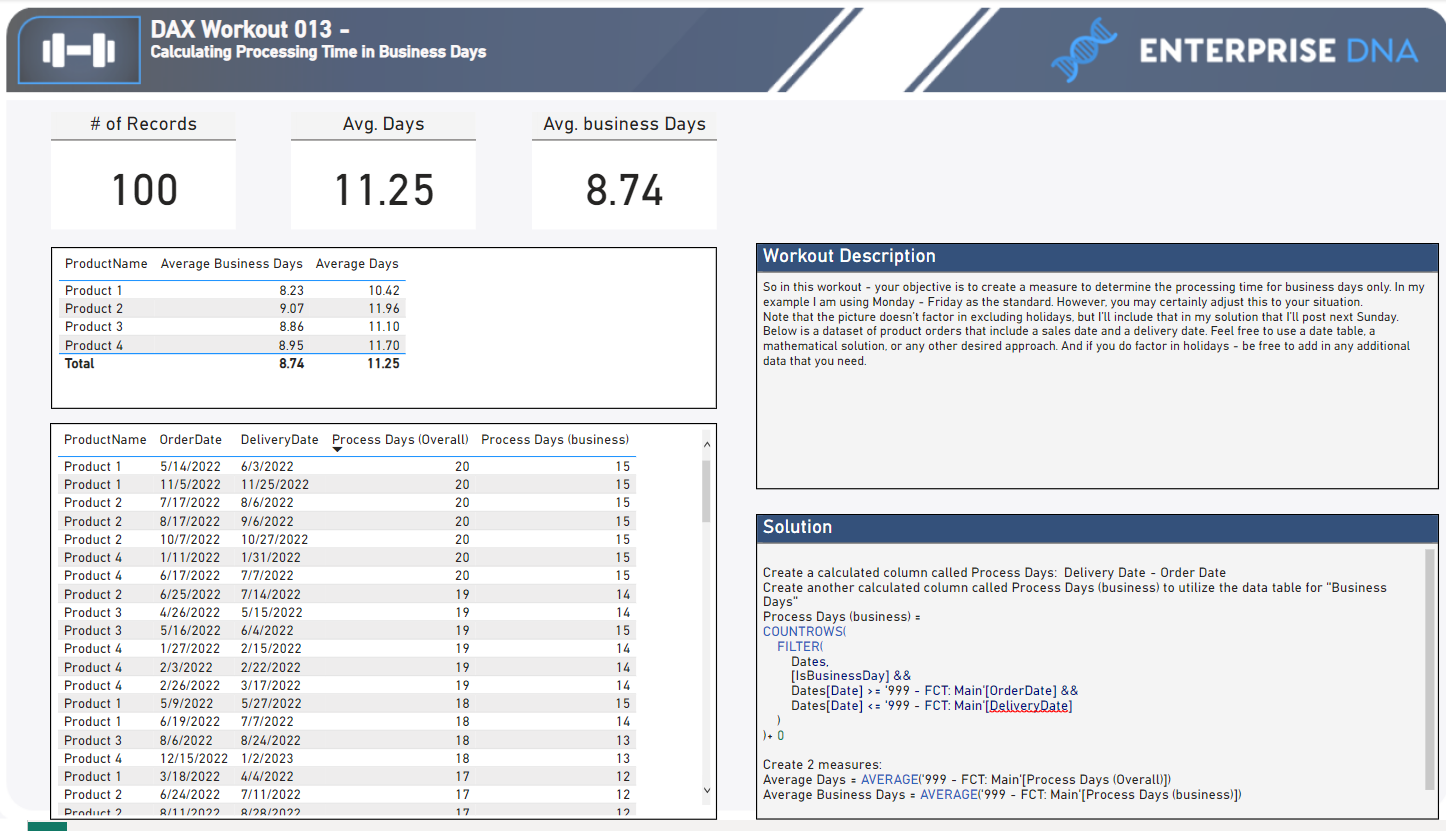
So in this workout - your objective is to create a measure to determine the processing time for business days only. In my example I am using Monday - Friday as the standard. However, you may certainly adjust this to your situation.
Note that the picture doesn’t factor in excluding holidays, but I’ll include that in my solution that I’ll post next Sunday.
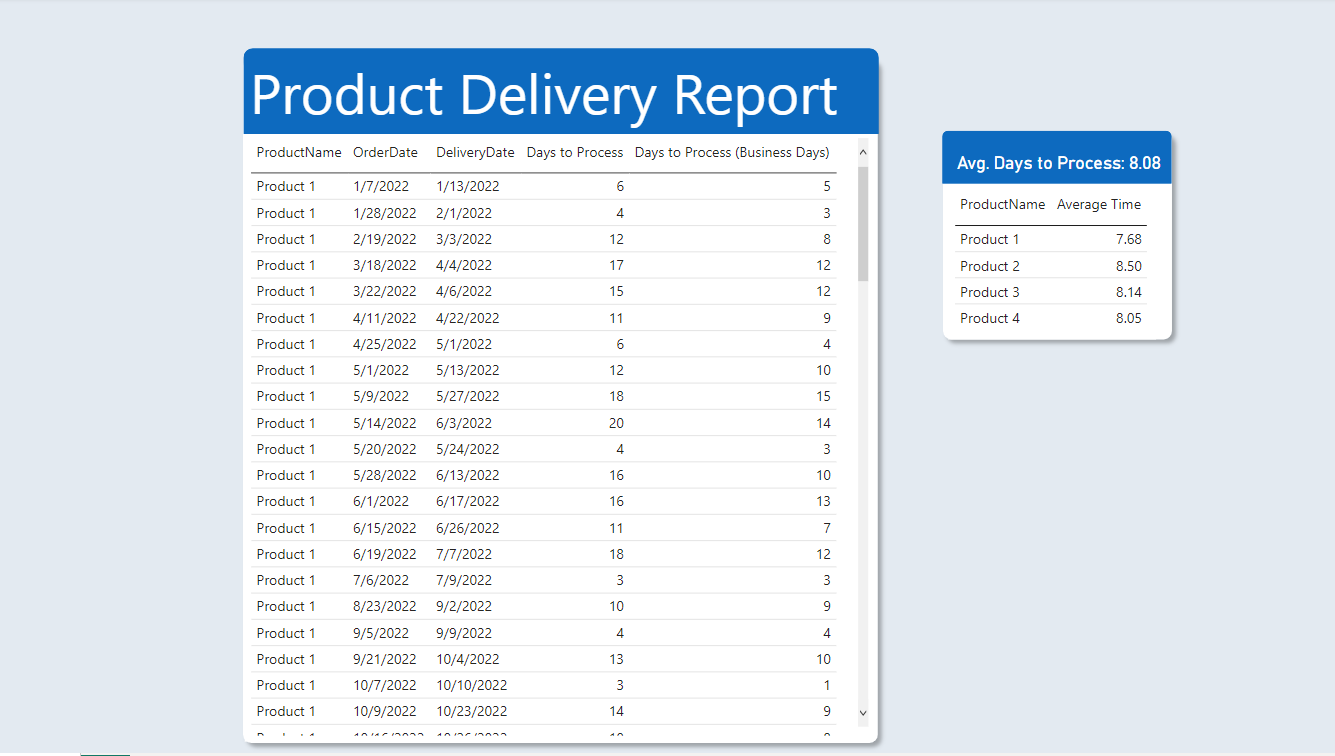
Below is a dataset of product orders that include a sales date and a delivery date. Feel free to use a date table, a mathematical solution, or any other desired approach. And if you do factor in holidays - be free to add in any additional data that you need.
Submission
Load the supplied data file, create your solution, and reply to this post. Upload a screenshot of your solution (or the PBI file) along with any DAX items. Please blur any solution or place it in a hidden section.
Great, practical workout. I like the “choose your own adventure” aspect of the optional elements.
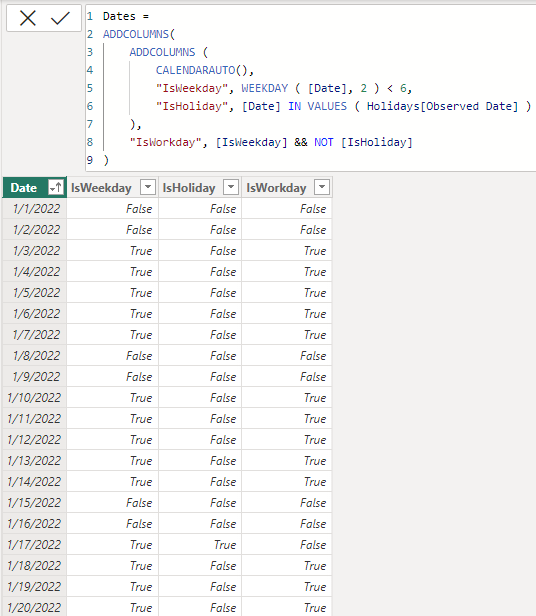
I chose to pull in holiday dates automatically through an API call in Power Query to Calendarific.com (will post about this tonight…)
@Melissa 's awesome Date table code makes this a piece of cake, since you just point her code to your holiday table and her Dates table updates the IsBusiness Day field automatically to account for weekends and holidays.
Here’s a link to it for anyone who isn’t already currently using it.
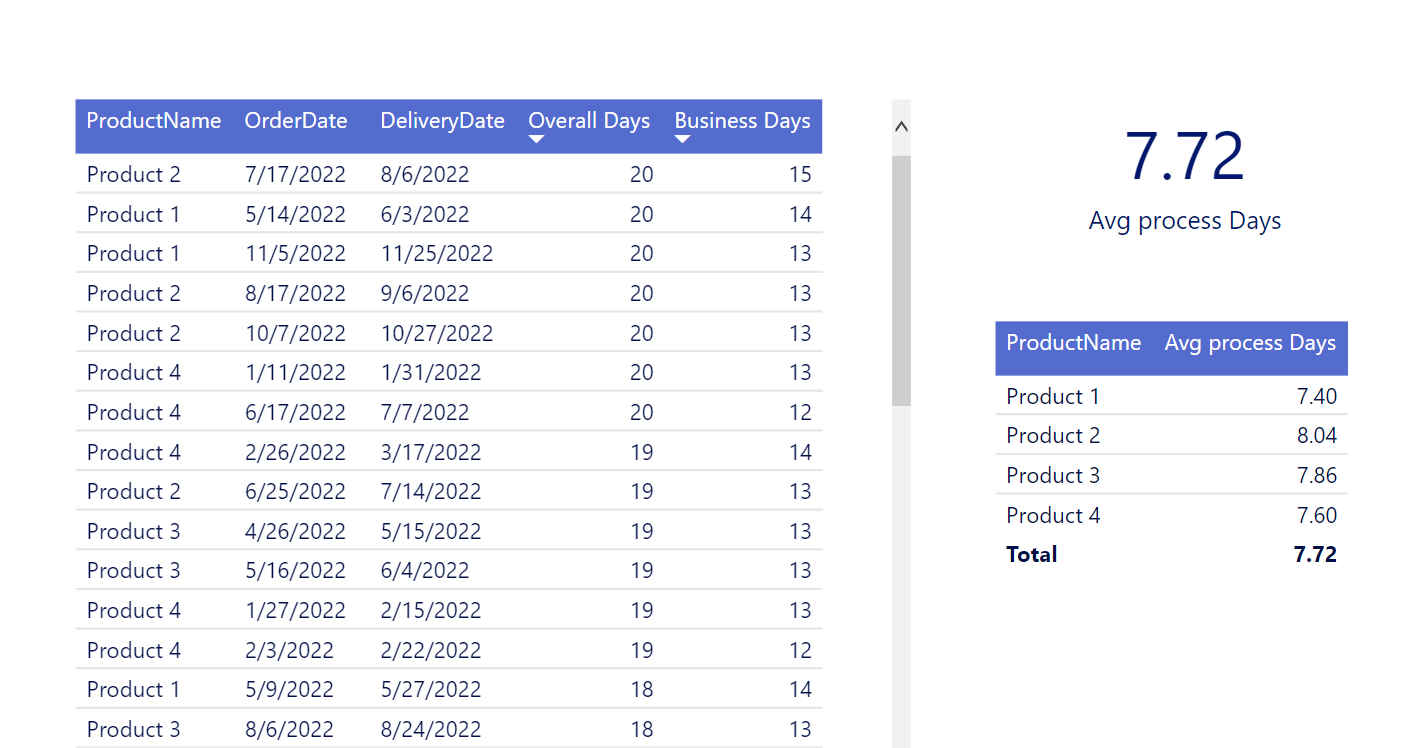
I cleaned the Order and Delivery dates (NB: some were in wrong date format) using Power Query by splitting the columns (using the \ delimeter) and then created a new column for each of the dates using the Custom Column feature.
I used Melissa’s great date table (see the link @BrianJ sent)
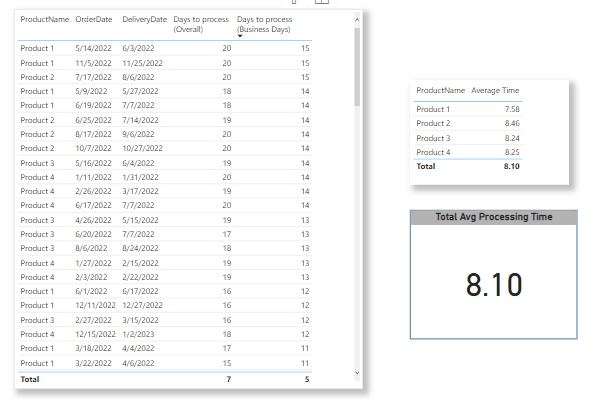
I Created simple calculated columns for the Overall and Business days
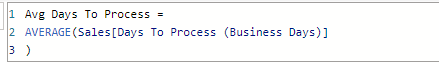
Then used the AVERAGE fxn to create a measure for the Avg Process Days.
Days to Process = DATEDIFF(SELECTEDVALUE('Workout 013 Data'[OrderDate]),SELECTEDVALUE('Workout 013 Data'[DeliveryDate]),DAY)
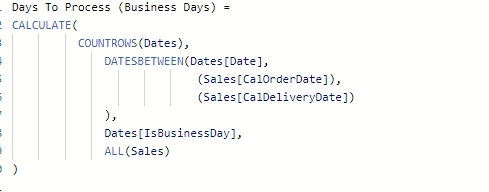
Days to Process (Business Days) =
NETWORKDAYS(SELECTEDVALUE('Workout 013 Data'[OrderDate]), SELECTEDVALUE('Workout 013 Data'[DeliveryDate]), 1, VALUES(Holidays[ DATE]) )
Average Time = AVERAGEX('Workout 013 Data', [Days to Process (Business Days)])
For those interested, here’s the link to my LinkedIn post tonight with the code for an automated holiday table that will pull the holiday dates for any requested years for over 230 countries and 3,300 states in 100+ languages.
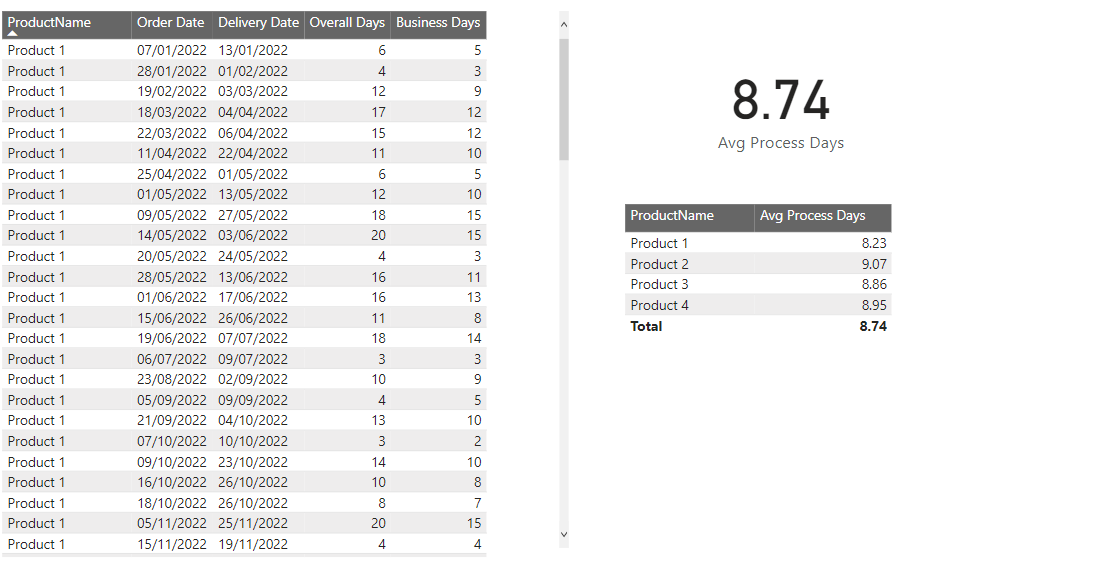
I am a beginner at DAX but just love it! The help provided here and on the Microsoft forums are great help and guidance. I have attached my PBIX file for review.
Step 1: Uploaded the .xlxs table to power bi
Step 2: Uploaded the calendar that I always use (From Avi Singh)
Step 3: Created a holiday table and uploaded
Step 4: Created a custom coloumn for Days to Process (incuding weekends and holidays)