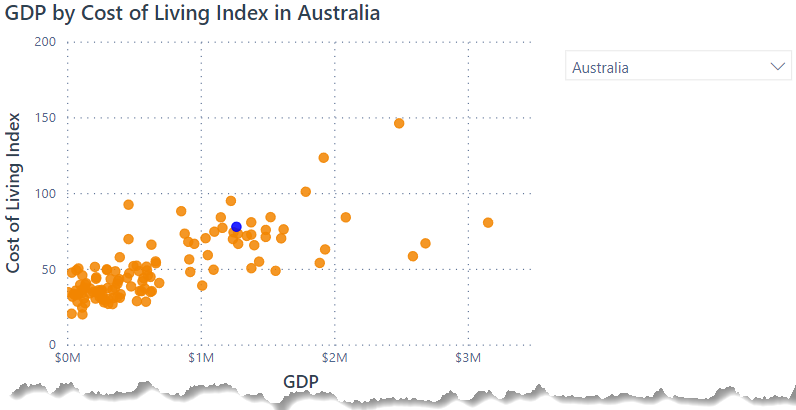
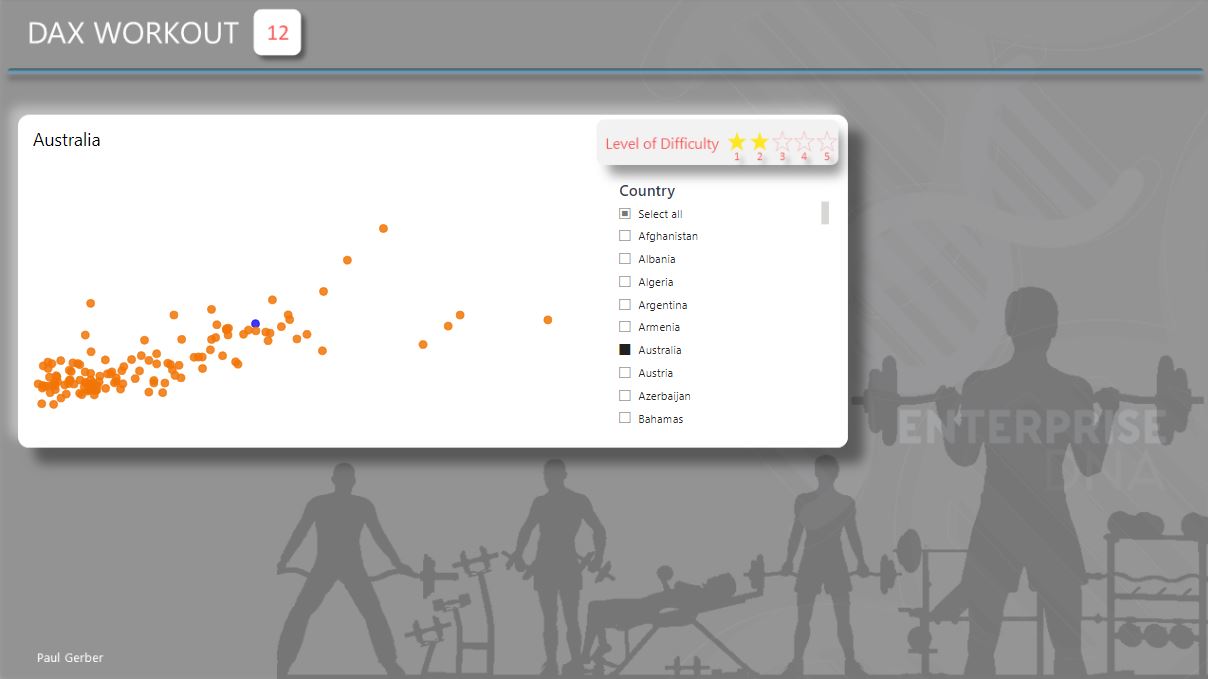
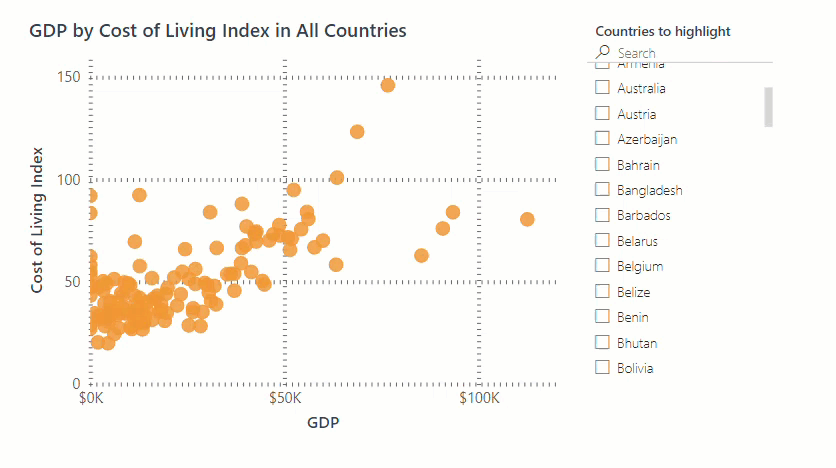
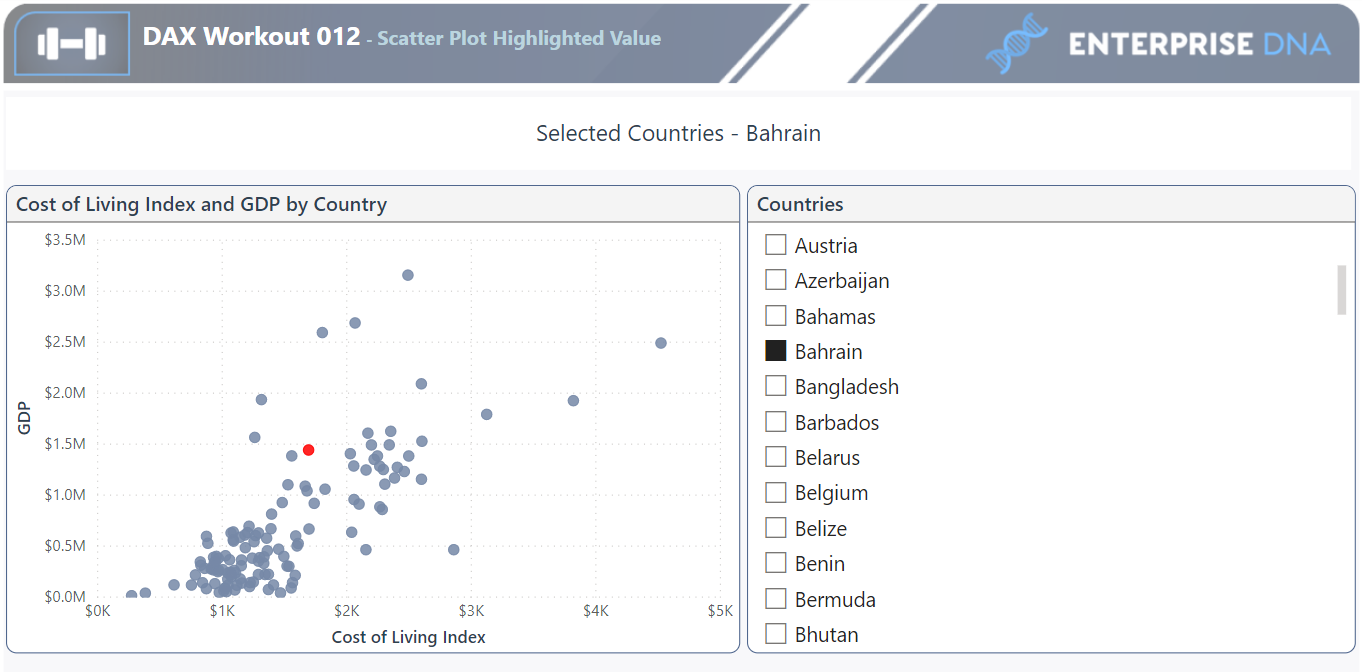
Welcome to another DAX workout. In this workout, you are asked to create a scatter chart that will highlight the Country when selected by a slicer. Also, create a dynamic title that shows the country selected.
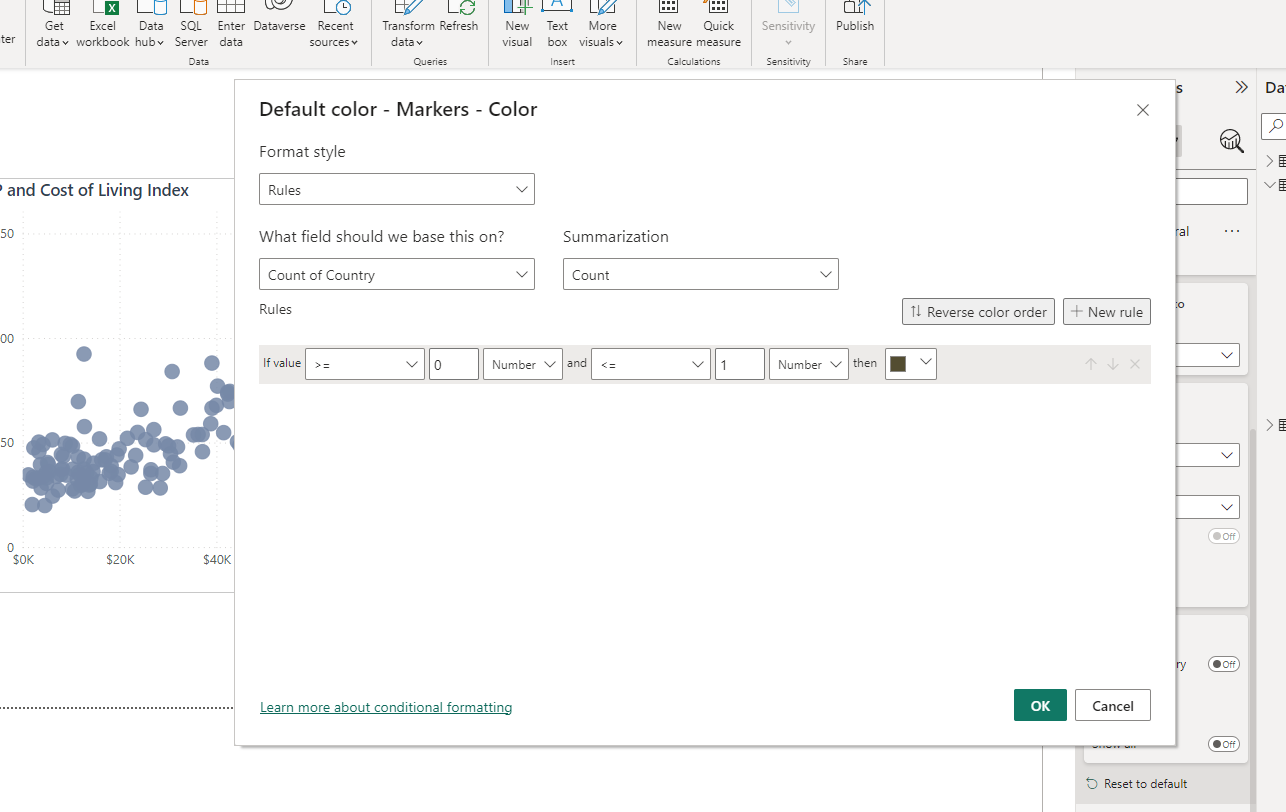
My colors are blue for the highlight and tangerine for the rest. Feel free to use your own colors.
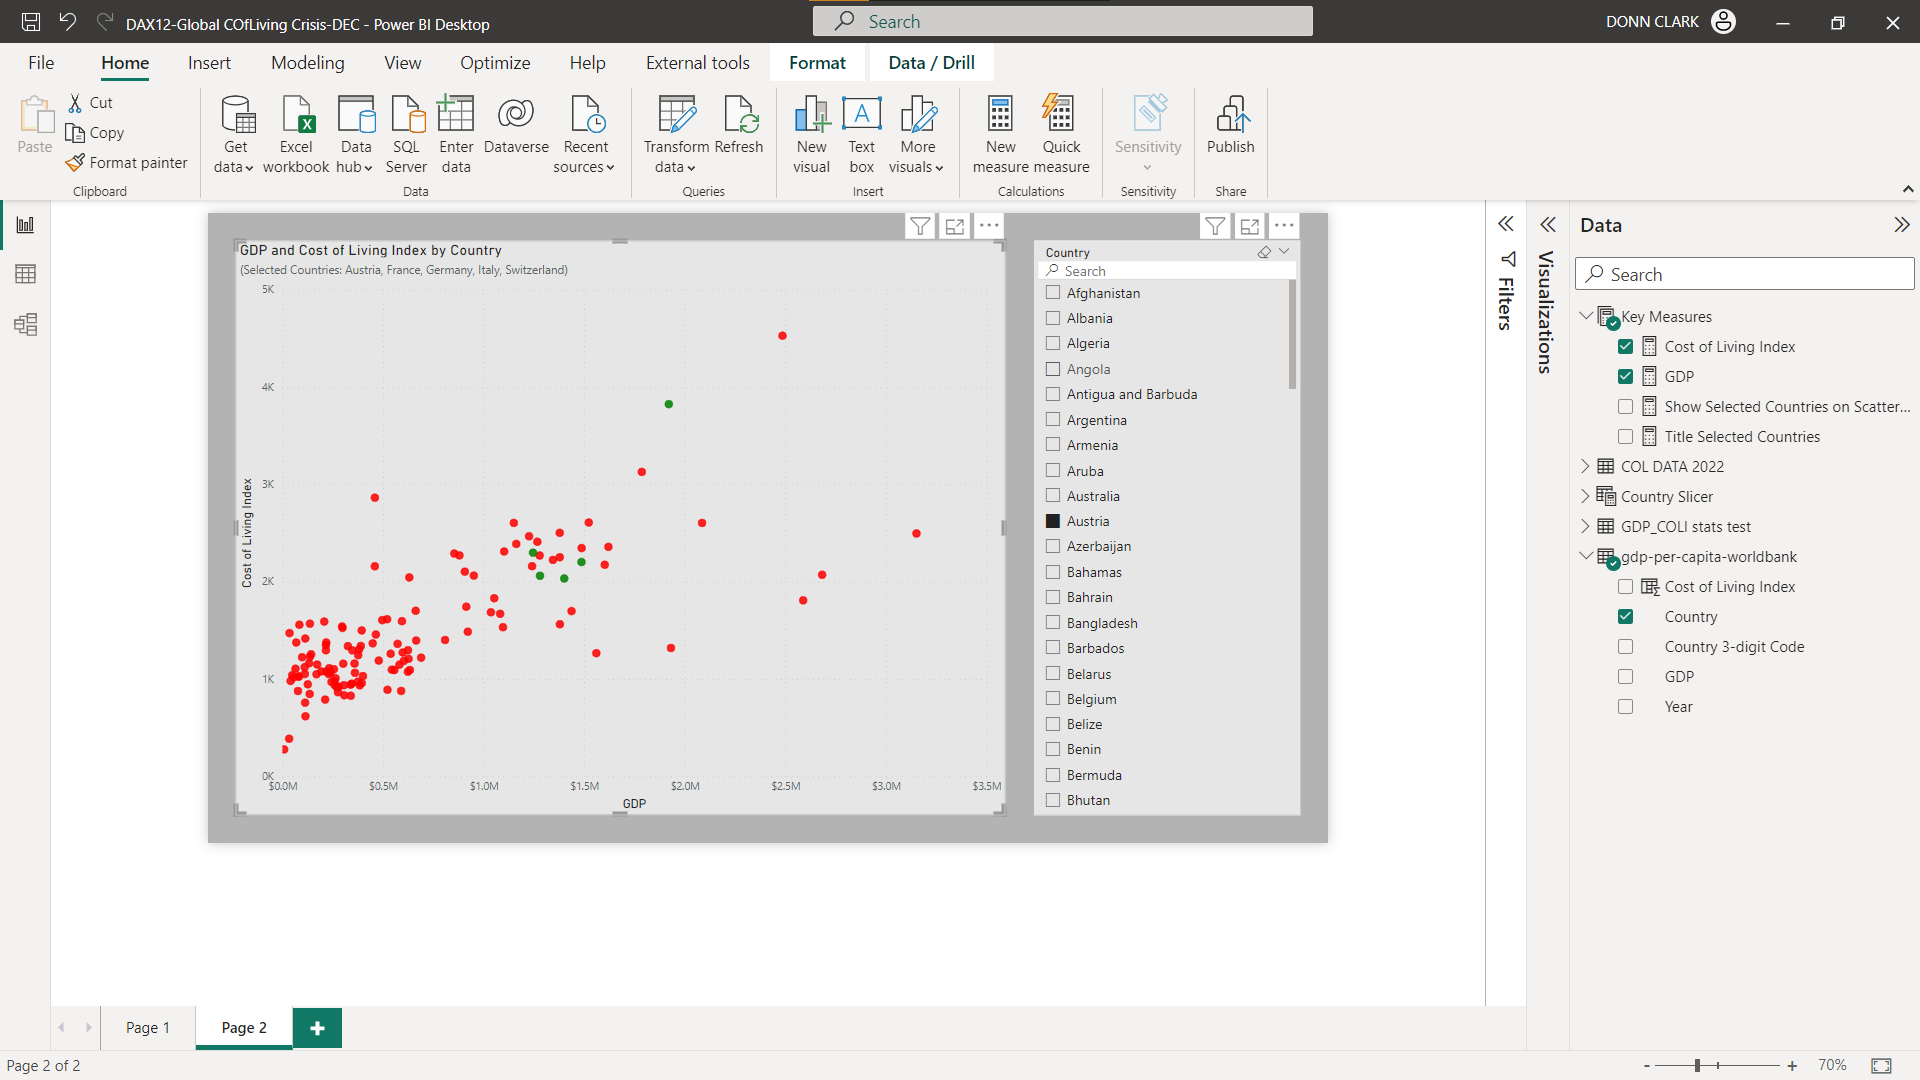
If you want to challenge yourself further, modify the Dynamic Title measure to display multiple countries.
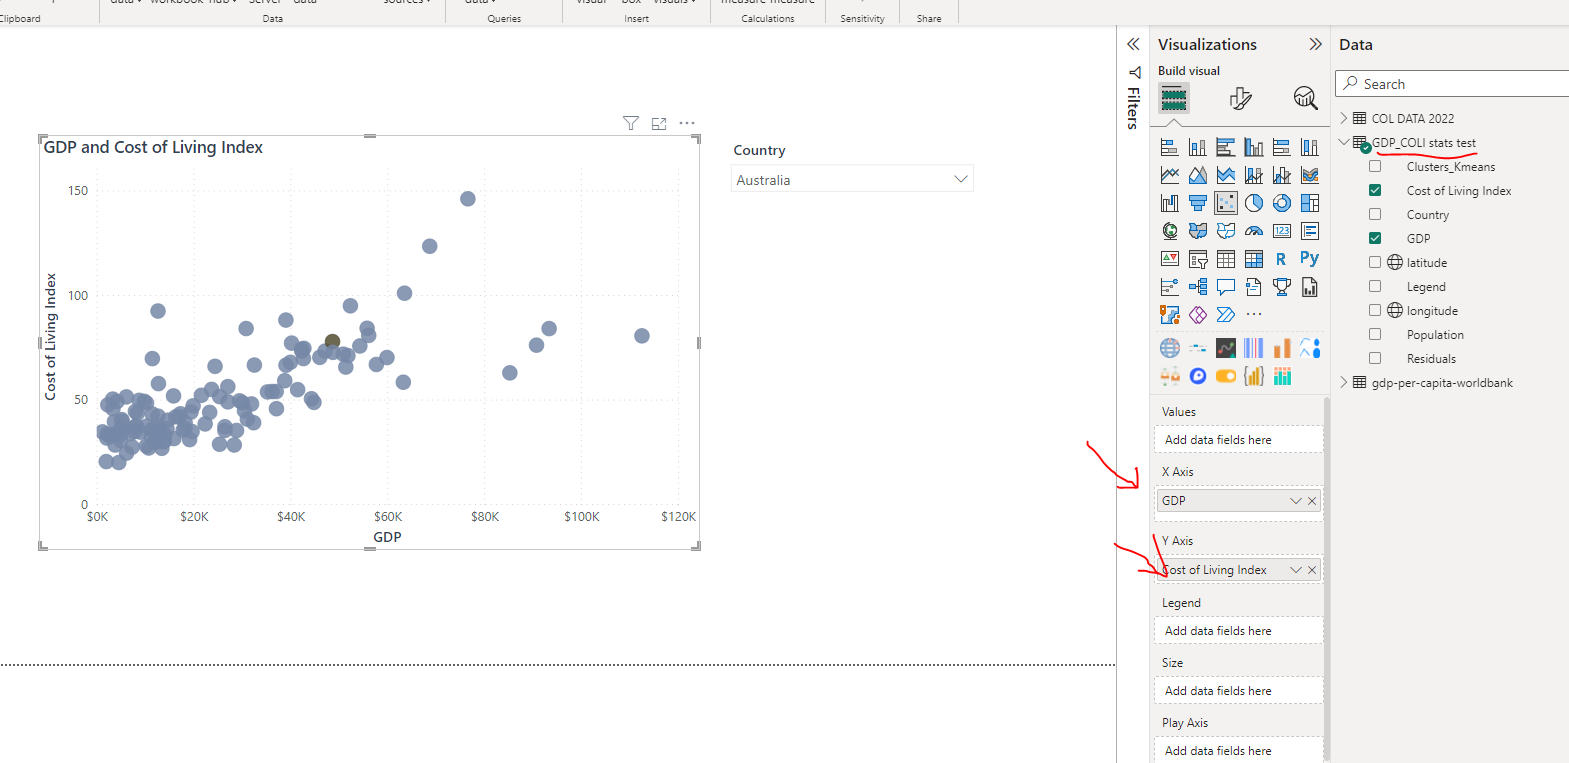
Use the COL DATA 2022 table. The other tables have extra information if you want to use it.
Load the supplied data file into a new Power BI file, create your solution, and reply to this post. Upload a screenshot of your solution along with the DAX measure. Please format your DAX code and blur it or place it in a hidden section.
Period
This workout will be released on Thursday, April 27, 2023, and will end on Sunday, April 30, 2023. But you can always come back to any of the workouts and solve them.
Is part of the workout intended to be deciphering the model? It’s not immediately clear to me what tables and dimensions are intended to be used and why there are so many.
Ok. I didn’t see the column with GDP. I was mistakenly using your 'COL DATA 2022'[GDP_COLI stats test.Population] column at first. then I thought perhaps it was the 'GDP_COLI stats test'[GDP]. Maybe the column is hidden in there somewhere
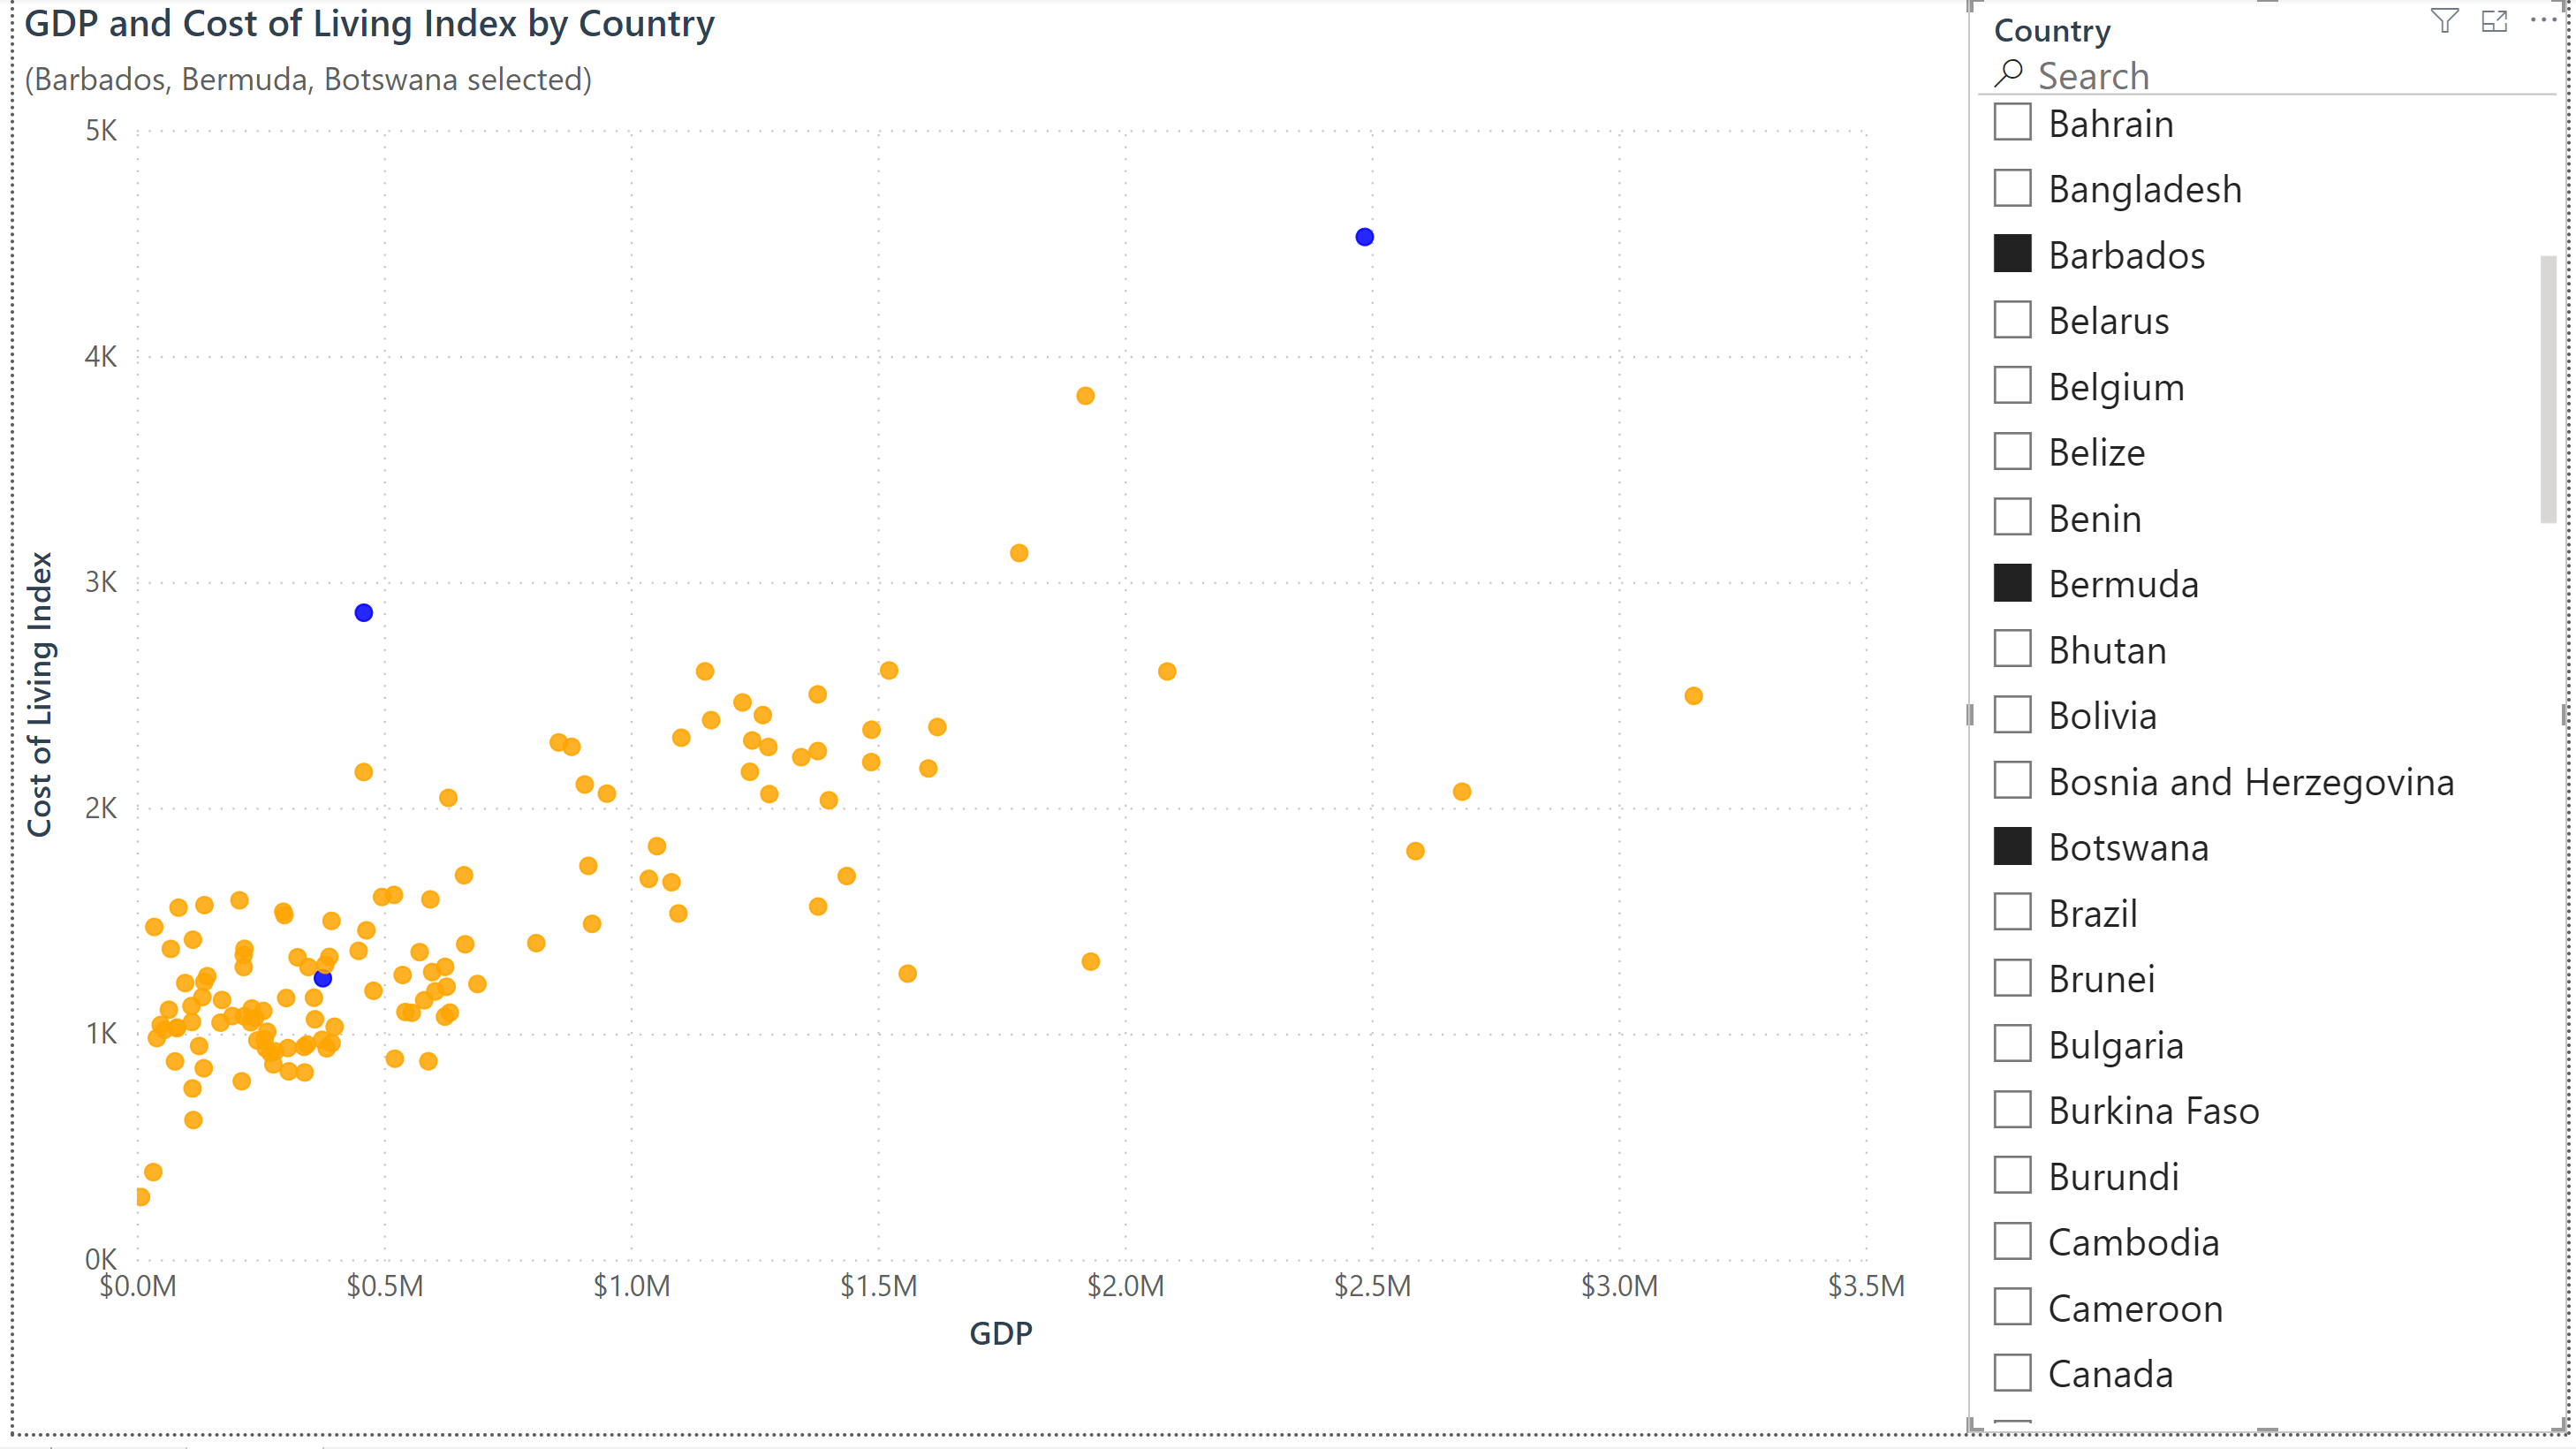
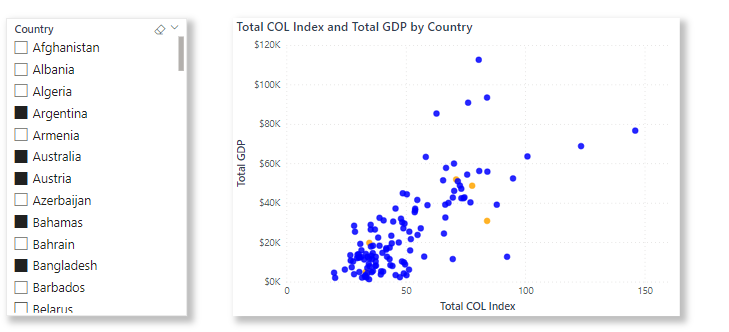
At any rate, the GDP values below are incorrect but the minimal workout is complete:
I’m really enjoying these workouts, honestly. They compactly present nuanced, real-life scenarios that you just can’t experience in such a short time otherwise. Some of the problems have been complicated enough that they’ve entertained me in my off time. And, so far, I’ve gained a nugget or two out of every one that I’ve approached.
I only follow the DAX, deneb, and data visualization workouts. And I joined the party late: I didn’t know about the workouts until a couple of weeks ago. I haven’t started to work backwards through the earlier problems.
Thanks for the great response @HufferD I appreciate that and knowing what you are learning or getting from these. They will always be available for you to come back to.
@Paul.Gerber just double checking, the only GDP columns I can see in the COL DATA 2022 table are GDP_COLI stats test.Residuals & GDP_COLI stats test.Population.
I initially thought of doing a lookup on the “GDP_COL1 stats test” table using
country and cost of living index columns to fetch the GDP.
Really amazing workout learned all the functions from the course, and these workouts really helped me to learned how and where to use those functions in different aspects