DAX Workout 011 - Creating dynamic groupings

Everyone,

So this workout is focused on one of my favorite uses of DAX. It is also one of the first uses that I learned years ago from an article Sam McKay posted on this site. It’s all around grouping your data in categories but in a way that is both easy to set up but also enables you to change the groups fairly easily. Back in my Excel days, I would have done this by adding a column with a number of nested IF statements. But a DAX measure makes this so much easier.

Workout Overview
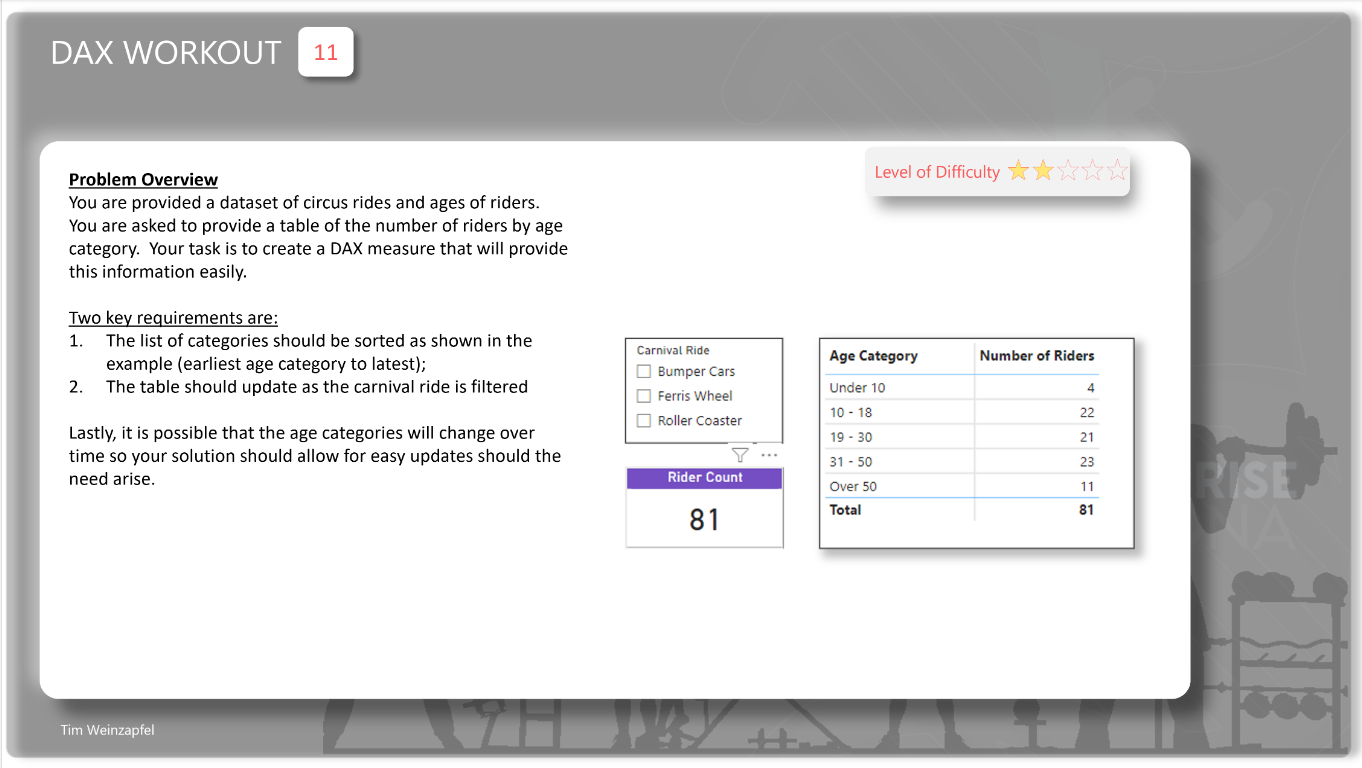
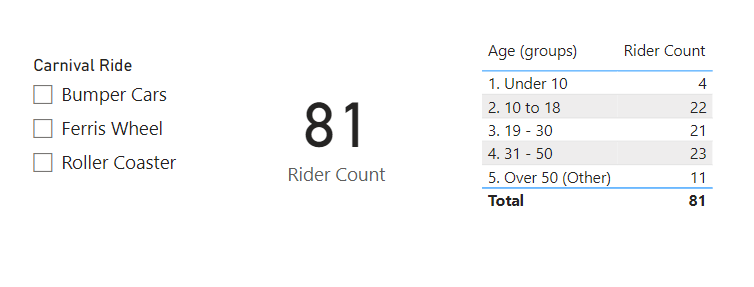
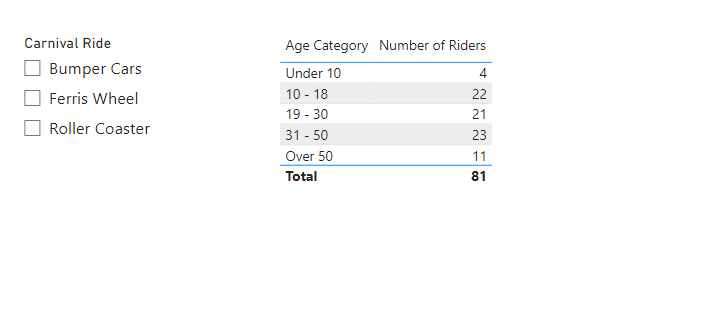
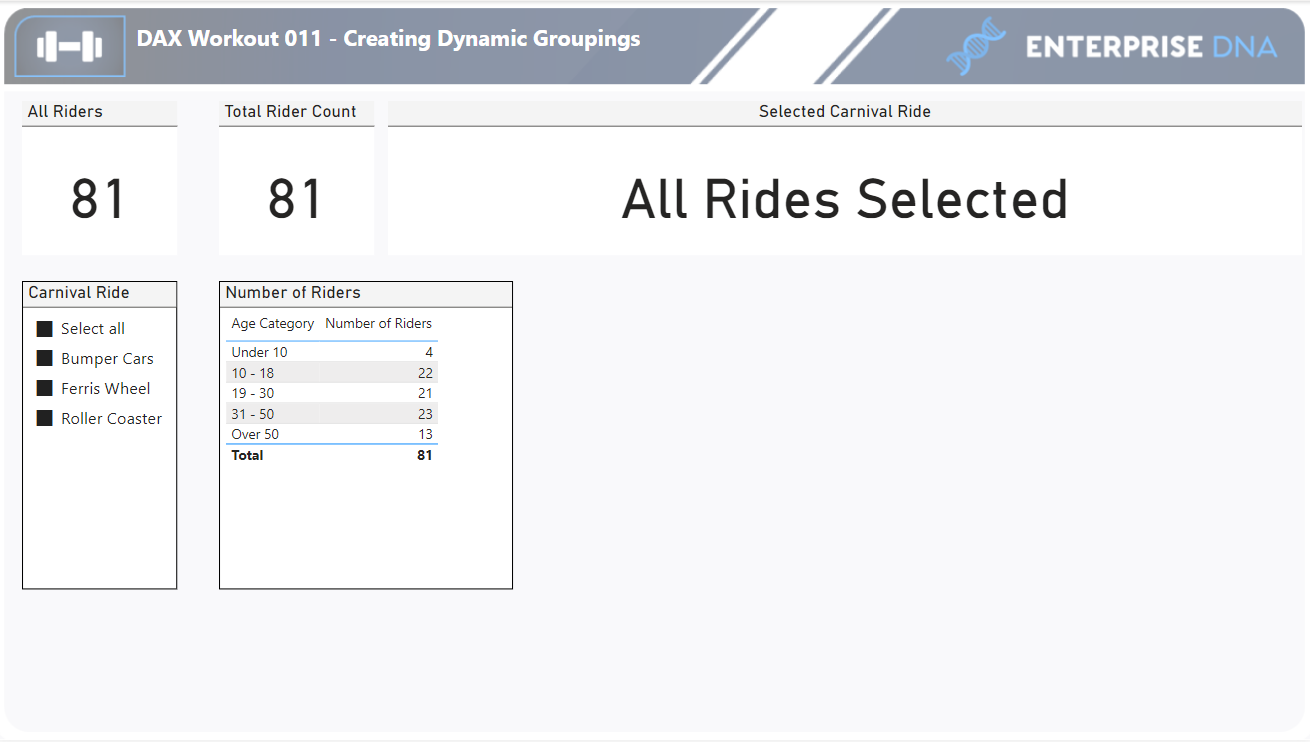
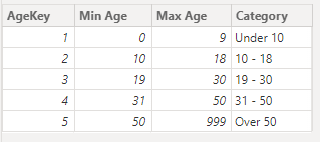
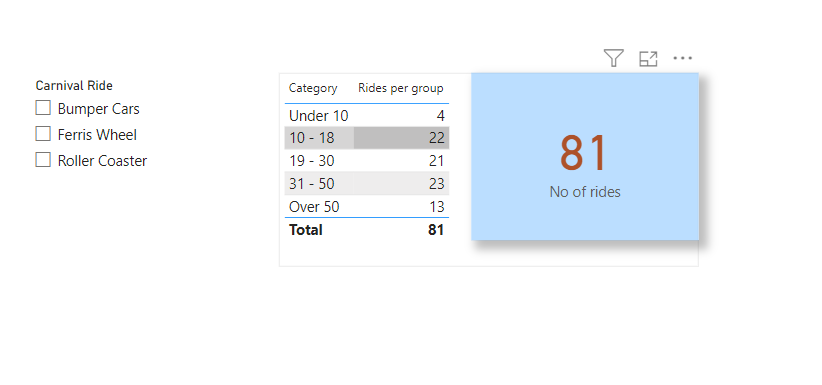
For this workout, the dataset is a simple list of circus rides and the age of a specific rider. The objective is to create a DAX measure that will show the number of riders between various age groups. In addition, create the DAX measure so that you can change the categories without having to change the measure. And the numbers should update if the circus ride is filtered.

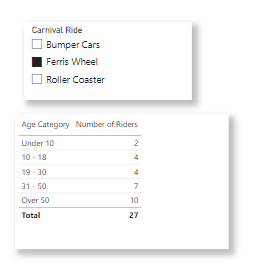
And remember to keep an eye on the “Total” line to ensure it’s being calculated properly!

Here is a link to the dataset:
Workout 011 Data.xlsx (11.9 KB)

Submission
Load the supplied data file, create your solution, and reply to this post. Upload a screenshot of your solution (or the PBI file) along with any DAX items. Please blur any solution or place it in a hidden section.

4 Likes

Not sure where the required DAX solution starts and ends as the age category table has to be data-model defined somewhere - i did so in Power Query, i.e. if a change to groups is required go to Power Query editor. :slight_smile:

I assume, that age of rides start at 0 year and ends at 150 year. :slight_smile: Further I assume that the fact table is extracted from XLSX file as a query “input”. Finally, I assume that human input that defines Age category is free of human error (I know, it is very strong assumption :stuck_out_tongue: ).

Two approaches presented.

One is based on disconnected table (i.e. Age Category table has no relationship to fact table with rides) and calculate-free DAX:

Number of Riders Disconnected table =
VAR __prepTbl =
ADDCOLUMNS (
ageCategory,
@ridersCount”,
VAR AgeStart = [AgeStart] + 0
VAR AgeEnd = [AgeEnd] + Divide(0, [AgeEnd], 150)
RETURN
COUNTROWS (
FILTER ( input, [Person Age] >= AgeStart && [Person Age] <= AgeEnd )
)
)
VAR __out =
SUMX ( __prepTbl, [@ridersCount] )
RETURN
__out

Other is based on some power query and requires really simple just-a-function DAX as the rest is done by relationship:

Number of Riders Relationship based = CountRows(input)

PBIX file:
Workout 011.pbix (31.5 KB)

No CALCULATE DAX makes quick work of this one. Just a table variable, adding the proper Age Category (pulled from the helper table) to the main table, and then counting the rows of the virtual table by Age Category, with a little extra rigamarole to fix the measure totals…

Click for DAX Code

Ride Count by Category =

VAR __vTable = 
ADDCOLUMNS(
    ALLSELECTED( Rides ),
    "@Category", 
    MAXX(
        FILTER(
            ALL( 'Ages' ),
            Rides[Person Age] >= 'Ages'[MinAge] &&
            Rides[Person Age] <= 'Ages'[MaxAge]
        ),
        Ages[Age Category]
    )
) 

VAR __Result = 
IF(
    HASONEVALUE( Ages[Age Category] ),
    COUNTROWS(
        FILTER(
            __vtable,
            [Harvest Age Category] = [@Category]
        )
    ),
    COUNTROWS( __vTable )
) 

RETURN
__Result

Define an age category table:

DAX Datatable
Age = 
DATATABLE (
    "AgeKey", INTEGER,
    "Min Age", INTEGER,
    "Max Age", INTEGER,
    "Category", STRING,
    {
        { 1,  0,   9, "Under 10" },
        { 2, 10,  18, "10 - 18" },
        { 3, 19,  30, "19 - 30" },
        { 4, 31,  50, "31 - 50" },
        { 5, 50, 999, "Over 50" }
    }
)

Define the Number of Riders measure:

DAX Measure

Version 1:

VAR _MinAge = MIN ( Age[Min Age] )
VAR _MaxAge = MAX ( Age[Max Age] )
VAR _Riders =
    CALCULATE (
        COUNT ( Rides[Index] ),
        Rides[Person Age] >= _MinAge,
        Rides[Person Age] <= _MaxAge
    )
RETURN
    _Riders

Version 2 (No CALCULATE):

COUNTROWS (
    FILTER (
        Rides,
        Rides[Person Age] <= MAX ( Age[Max Age] ) &&
        Rides[Person Age] >= MIN ( Age[Min Age] )
    )
)

Workout 011 - Alexis Olson.pbix (24.4 KB)

2 Likes

@tweinzapfel:

image

Details
cuts = 
{
        (1,"Under 10", 0, 9),
        (2,"10-18",  10, 18),
        (3,"19-30",  19,30),
        (4,"31-50",  31,50),
        (5,"Over 50",  51,9999)
} 

Number of Riders = 
    COUNTROWS (
        FILTER (
            Sheet1
            , Sheet1[Person Age] <= MAX ( cuts[Value4] )
                && Sheet1[Person Age] >= MIN ( cuts[Value3] )
        )
    )

Thank you for the workout @tweinzapfel .

The first step I took was to create a new and unconnected table for the Age Group using the DAX code below:

Click to view DAX code
Age Category Table = 
    DATATABLE(
                "Index", INTEGER,
                "Minimum_Age", INTEGER,
                "Maximum_Age", INTEGER,
                "Category", STRING,
                
                {
                    {0, 0, 9, "Under 10"},
                    {1, 10, 18, "10 - 18"},
                    {2, 19, 30, "19 - 30"},
                    {3, 31, 50, "31 - 50"},
                    {4, 51, 70, "Over 50"}
                }
            )

Followed by a DAX code to count the number of riders per age category

Click to view DAX code
Number of Riders = 
    VAR min_age = MIN('Age Category Table'[Minimum_Age])
    VAR max_age = MAX('Age Category Table'[Maximum_Age])
    
    RETURN
        CALCULATE(
                COUNT(Sheet1[Index]),
                    FILTER(
                            Sheet1,
                            Sheet1[Person Age] >= min_age 
                            && Sheet1[Person Age] <= max_age))

Workout_011_Image

Lastly, the age group was arranged on the matrix table using the Index column in the Age Group table.

I learn something new every workout. The grouping solution by Sam is so quick and easy. I just added an age table, grouped the data and done with no dax!

Yet again Sam’s video on grouping was apt.

. I used a secondary table for the Age categories and harvested the Age ranges which I then use in the DAX code.

DAX Code

Summary

Screenshot 2023-04-27 112951

Everyone - thanks for participating in this one.

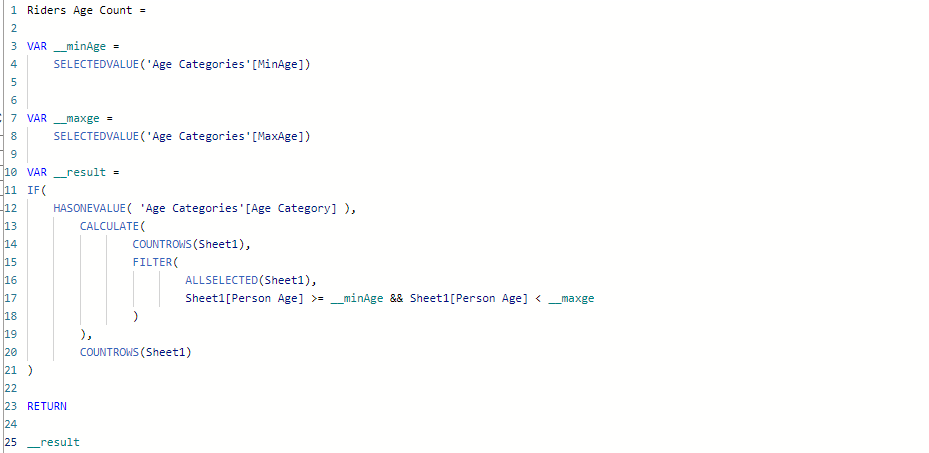
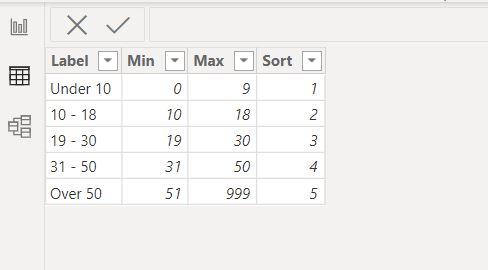
The way that I have approached it, similar to others, is by creating a separate simple table that has the categories and then Min/Max values. I also include a Sort column as this allows me to sort the categories how I want. One thing I like about this is that if the categories need to change (which in my experience they almost always do) - it’s just a matter of updating this data table.

(Side note - if you really wanted to get fancy here; another approach could be to embed a Power App directly in your PBI report; display this table of categories and configure the Power App to allow the user to edit the list themselves - and then use that as your datasource for the categories)

Workout 011 data pic

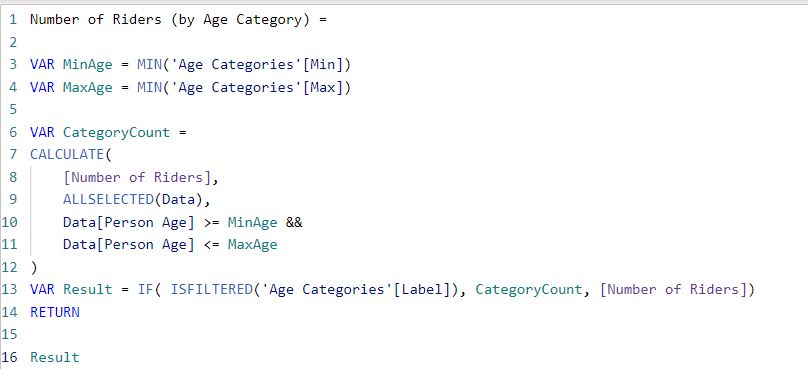
Then my DAX measure is below. I am using the ISFILTERED function as this ensures that the Total is shown correctly.

(Note - the [Number of Rideres] measure is not shown but is simply a COUNTROWS of the data)

3 Likes

Here is my submission
image

DAX Measure

This text will be hidden

Number of Riders =
SWITCH (
    TRUE (),
    HASONEVALUE ( 'Category Table'[Age Category] ),
        CALCULATE (
            COUNT ( Sheet1[Index] ),
            FILTER (
                ALLSELECTED ( Sheet1 ),
                Sheet1[Person Age] >= SELECTEDVALUE ( 'Category Table'[Min] )
                    && Sheet1[Person Age] <= SELECTEDVALUE ( 'Category Table'[Max] )
            )
        ),
    HASONEVALUE ( 'Category Table'[Age Category] ) <> TRUE (), CALCULATE ( COUNT ( Sheet1[Index] ) ),
    0
)

Here’s my submission.

I used the method taught by Sam for dynamic groupings in the DAX formula patterns course. I used a DAX formula to create the disconnected table for easy editing, since it’s basically impossible to edit a table created using the “Enter data” dialog on the Power BI UI.

See DAX below
Age groups = 
DATATABLE (
    "AgeKey", INTEGER,
    "Category", STRING,
    "Min Age", INTEGER,
    "Max Age", INTEGER,  
    {
        { 1, "Under 10", 0, 9},
        { 2, "10 - 18", 10, 18},
        { 3, "19 - 30", 19, 30},
        { 4, "31 - 50", 31, 50},
        { 5, "Over 50", 50, 999}
    }
)

No of rides = 
COUNTROWS(Data)

Rides per group = 
CALCULATE([No of rides],
    FILTER(
        VALUES(Data[Person Age]),
            COUNTROWS(
                FILTER('Age groups',
                    Data[Person Age] >= 'Age groups'[Min Age]
                    && Data[Person Age] <= 'Age groups'[Max Age]))
                >0)
)