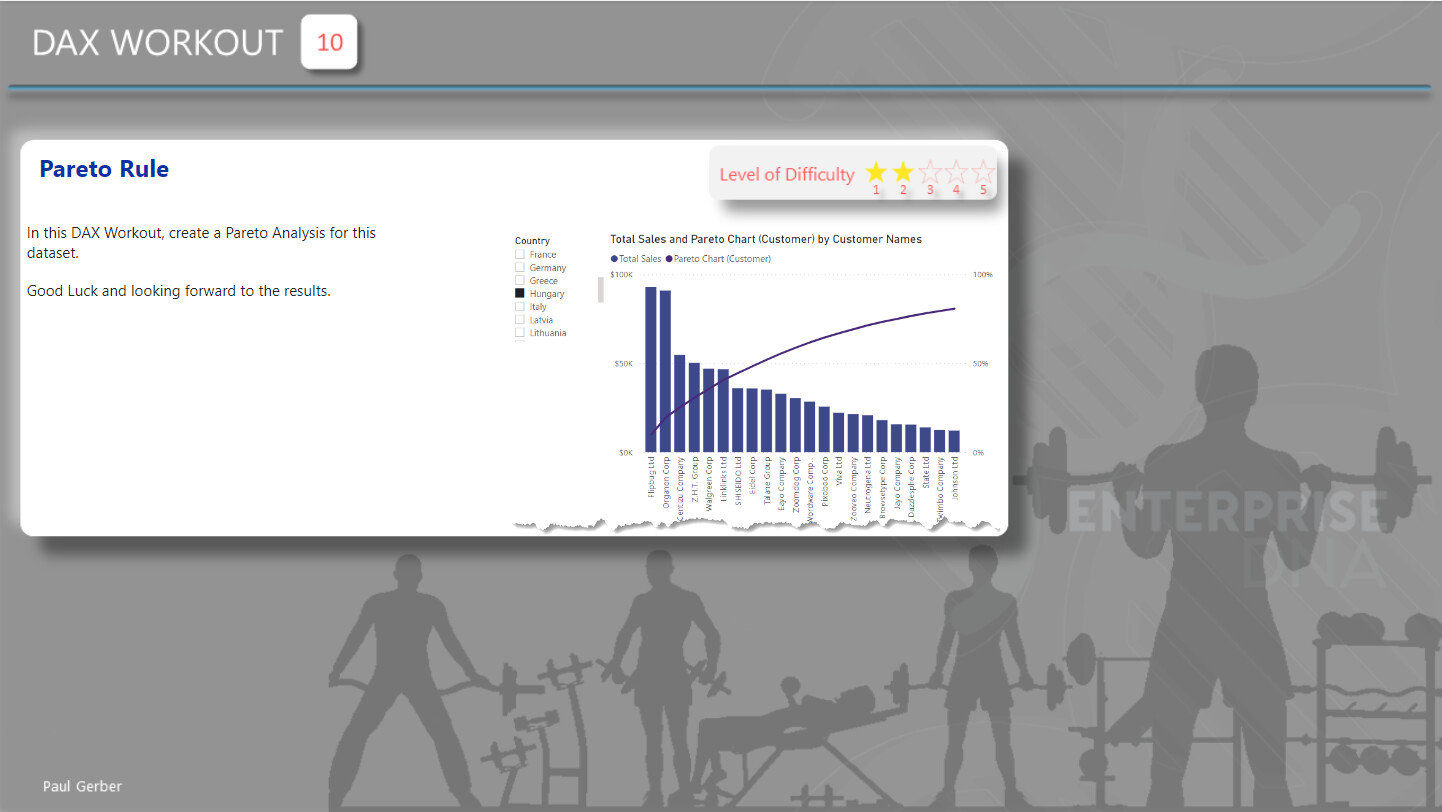
Load the supplied data file into a new Power BI file, create your solution, and reply to this post. Upload a screenshot of your solution along with the DAX measure. Please format your DAX code and blur it or place it in a hidden section.
Period
This workout will be released on Thursday, April 20, 2023, and will end on Sunday, April 23, 2023. But you can always come back to any of the workouts and solve them.
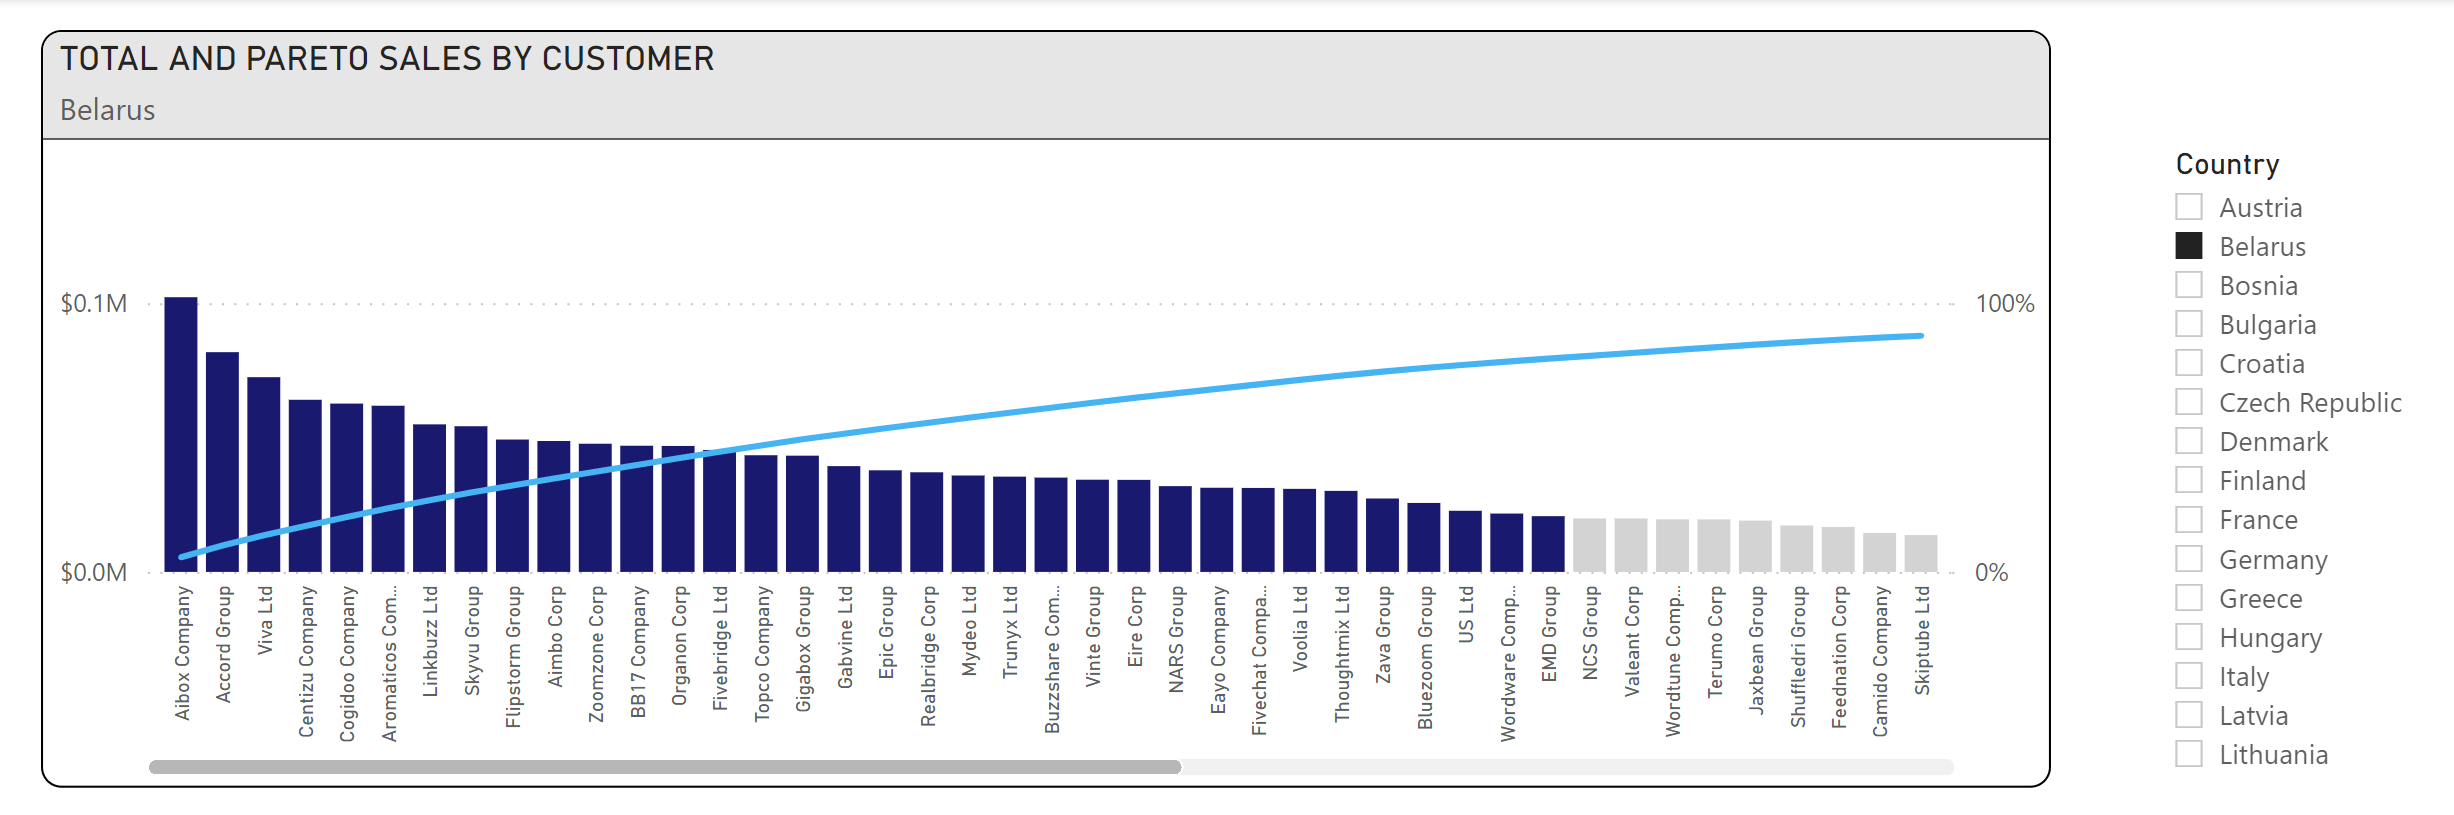
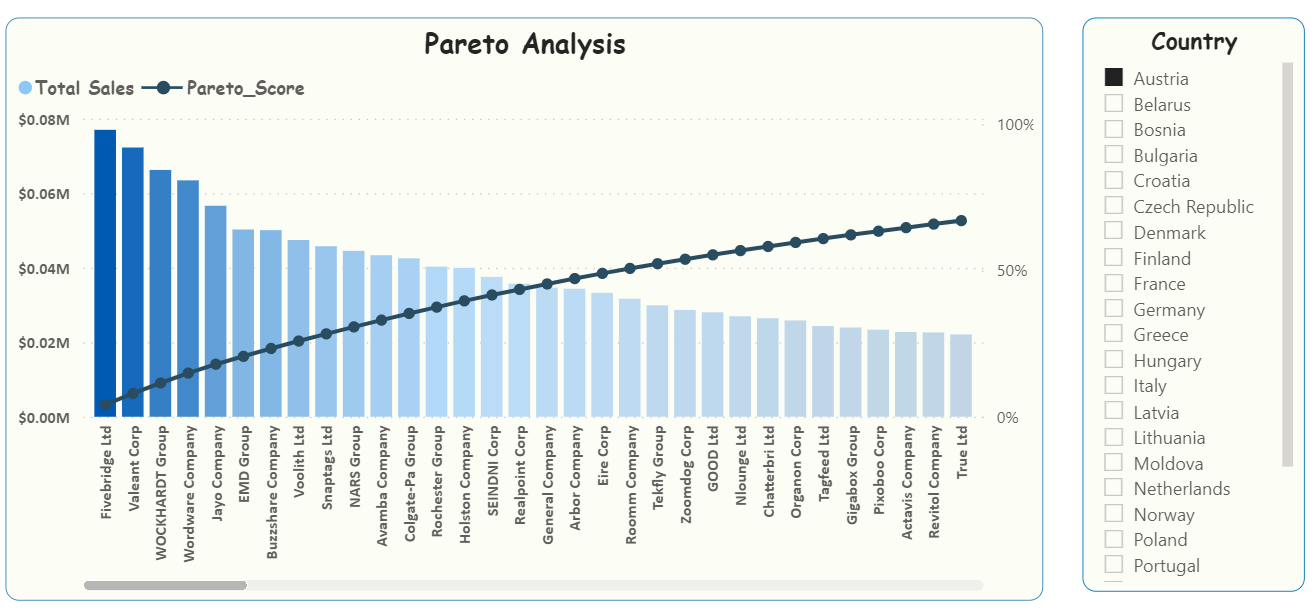
I’ve never been impressed with out-of-the-box pareto chart capabilities of power bi mainly because of the limited ability to annotate and enhance the visual with, say, x- and y-axis reference lines showing 80% of y and 20% of x or, even better, dynamic reference lines controlled by parameters. The real value for me is in drawing insights like, in the current example, what percentage of customers are responsible for what percentage of sales is that x to y ratio consistent across countries? Maybe less than 5% of customers account for more than 90% of sales in one country…Anyway, I find myself building charts like these in vega-lite more often than with the core visuals.
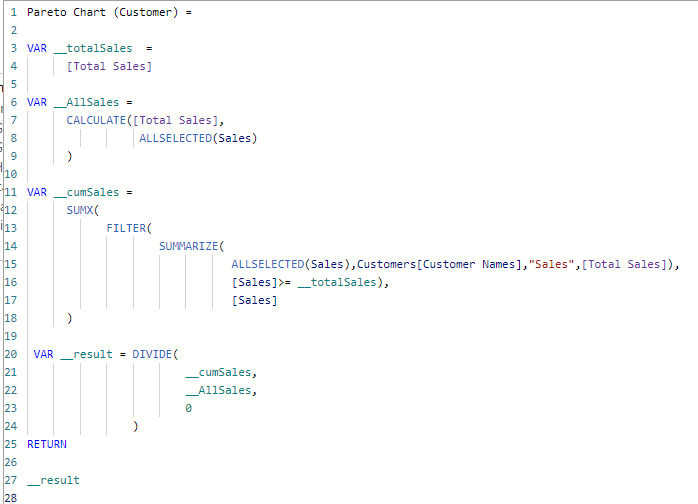
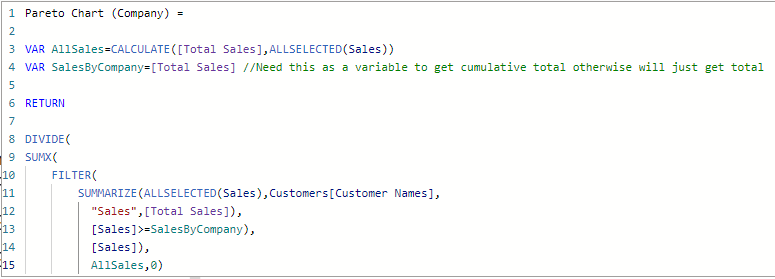
This is how I would calculate Pareto Chart (Customer) measure in your chart:
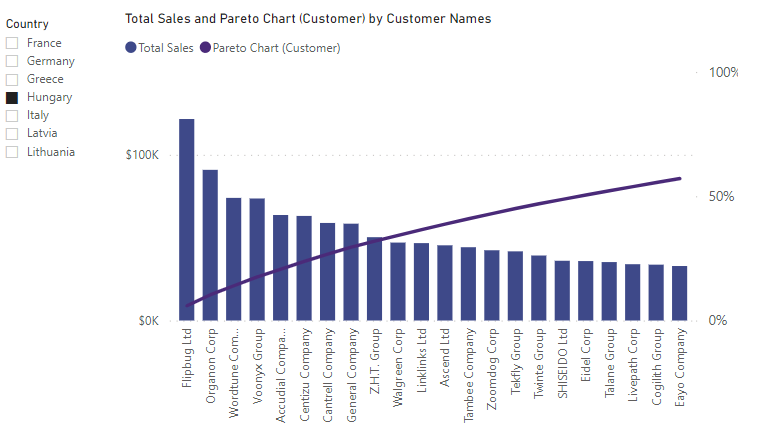
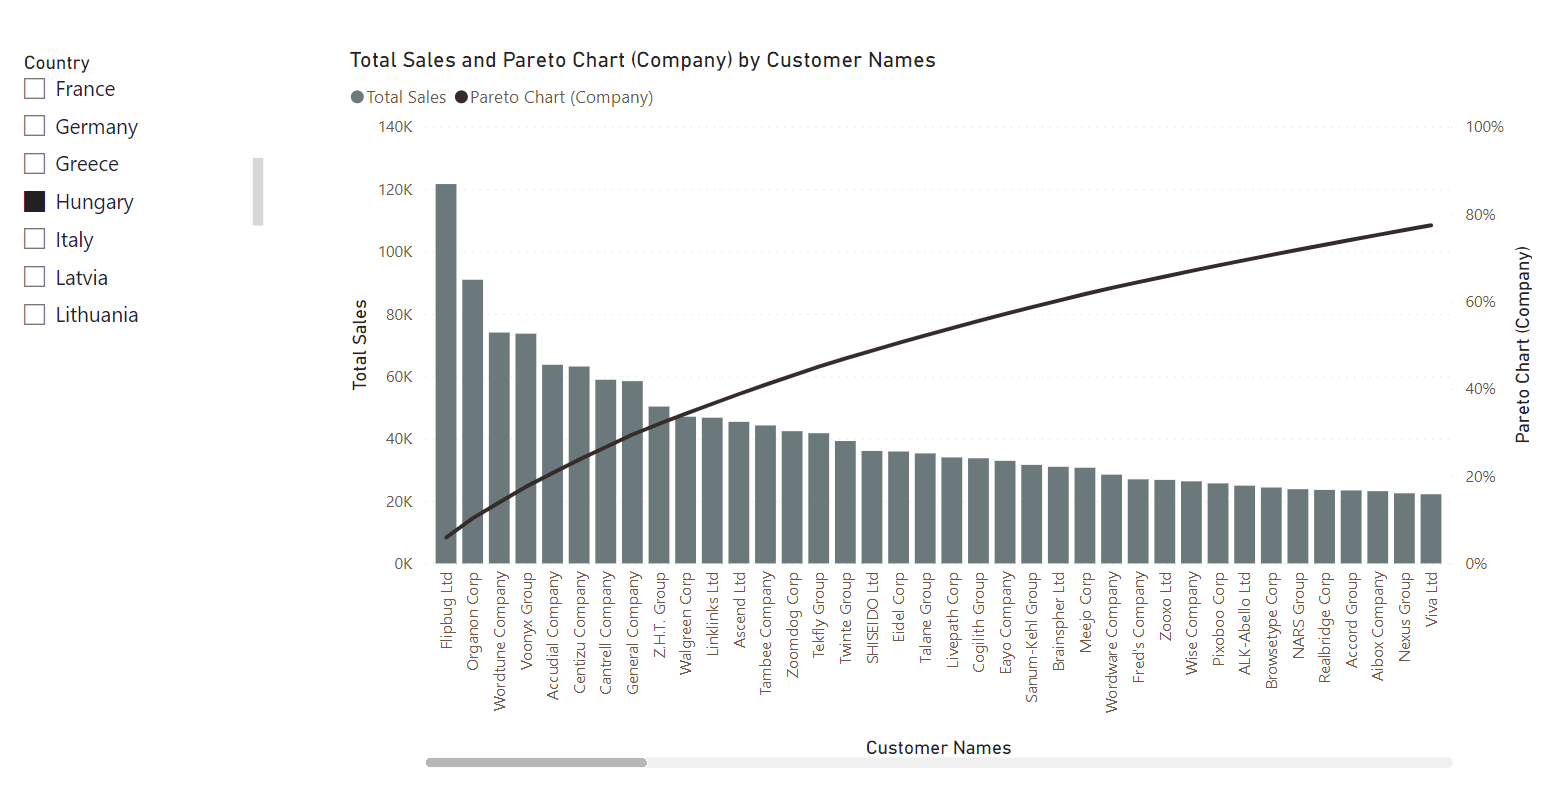
Here is my submission for this workout. I could have done this using windows functions but that has been covered already so used another method.
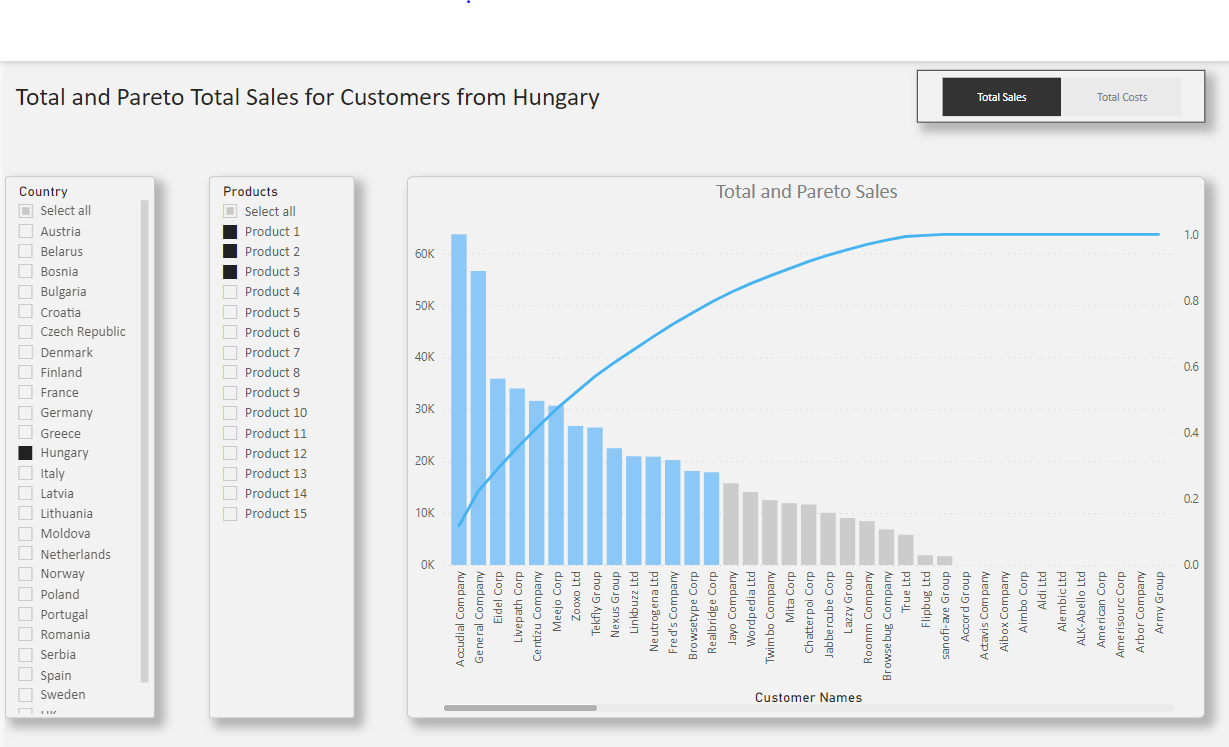
We can analyze sales as well as cost Pareto for each country and can see best and worst customers for product/s
Hi @Paul.Gerber, can you explain more about the context in this DAX. I am still unclear about comparing the sales in variance and sales in the virtual column created.
Hello @collier.brittany Are speaking about the virtual “sales” column in your DAX? Can you be specific with your question as to the problem you are facing? Or are you trying to understand the Pareto Rule?
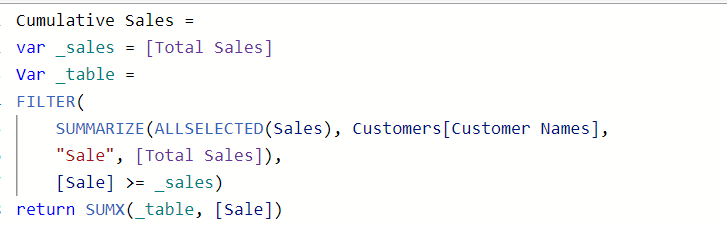
In the context of a Pareto analysis, the purpose of the DAX code you provided is to calculate the cumulative sales for each customer and to identify the top 80% of customers that account for 80% of the total sales.
The measure [Sale] represents the individual sales values for each customer, while the measure [Total Sales] represents the total sales value across all customers. The variable _sales are assigned the value of [Total Sales].
The FILTER function in the code filters the table generated by the SUMMARIZE function to include only those customers whose sales are greater than or equal to the total sales value. This effectively filters out customers whose sales are not significant enough to be included in the top 80%.
The SUMX function then iterates over the filtered table and calculates the cumulative sales for each customer. This allows you to identify the top 80% of customers that account for 80% of the total sales, which is a key step in a Pareto analysis.
Overall, the difference between [Sale] and _sales in this context is that [Sale] represents individual sales values for each customer, while _sales represents the total sales value across all customers. By comparing these two measures and filtering out customers whose sales are not significant enough, you can identify the top customers that account for the majority of the sales in your data set.
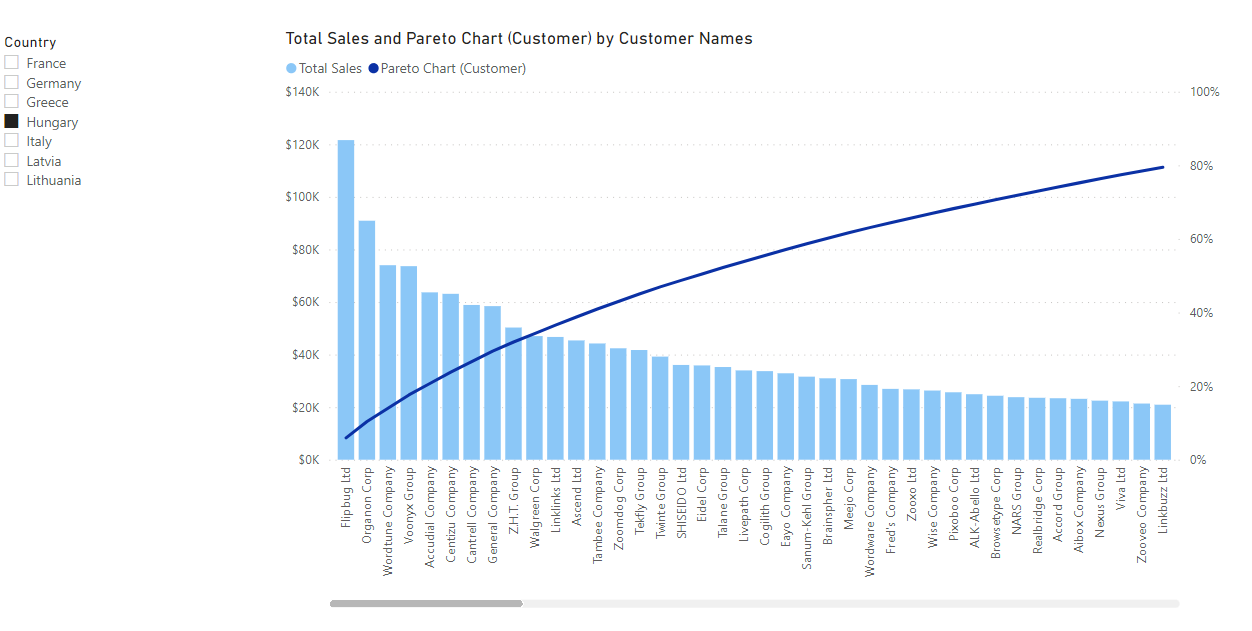
As the concept was new for me, it made me curious to understand and then proceed with implementation. Entreprise DNA YT Channel helped me clear the concept and doubts.
Attached is the outcome of the DAX workout.
Below is the DAX Code:
Pareto_Score =
/* Purpose of asssigning measure to a variable:variable helps evaluate before the below formula context*/
var total_sales = [Total Sales]
var allsales = CALCULATE([Total Sales], ALLSELECTED(Sales))
return
/* Main purpose:Divide cumumative sales by Total sales to derive upon 80%-20% rule per Pareto Principle*/